Free Access
Fig. 2.
Download original image
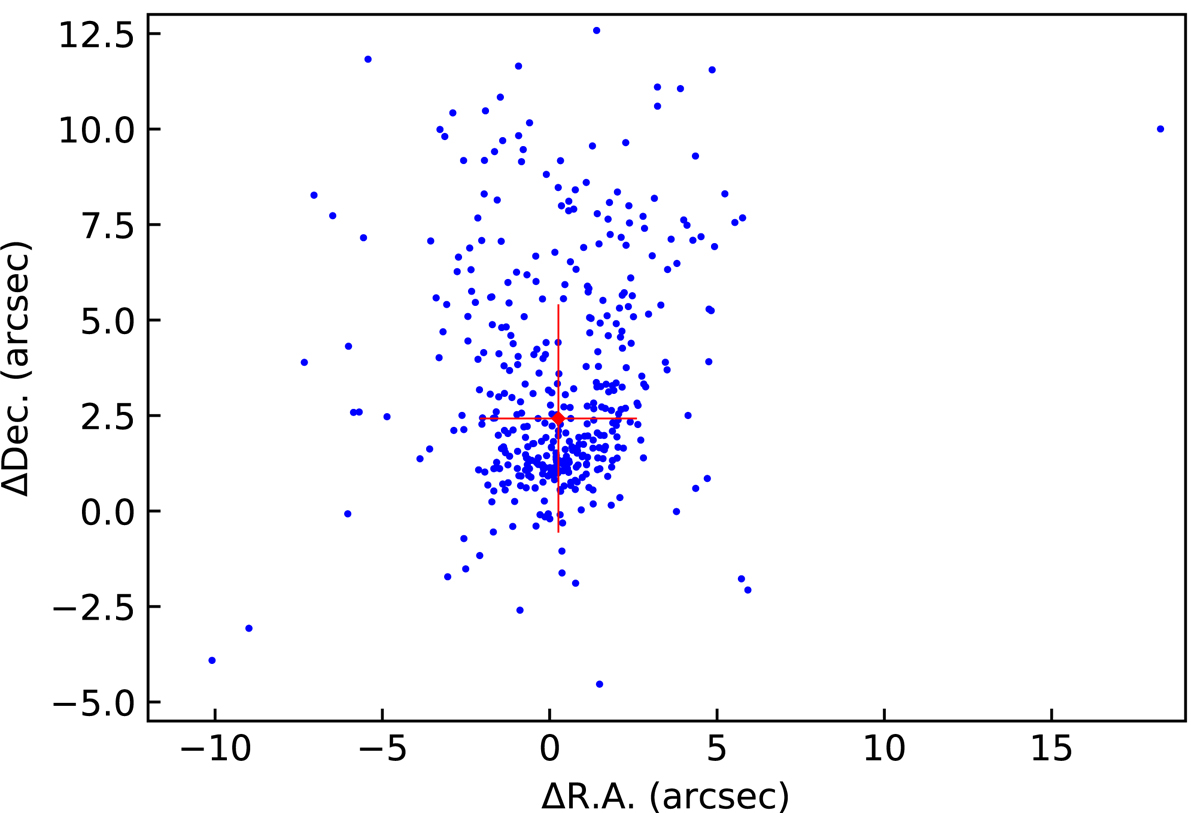
Differences in the source positions between our observations and the FIRST catalogue. The red cross shows the mean ΔRA and ΔDec of the scatter, where the uncertainties are the standard deviation.
Current usage metrics show cumulative count of Article Views (full-text article views including HTML views, PDF and ePub downloads, according to the available data) and Abstracts Views on Vision4Press platform.
Data correspond to usage on the plateform after 2015. The current usage metrics is available 48-96 hours after online publication and is updated daily on week days.
Initial download of the metrics may take a while.