Fig. 17.
Download original image
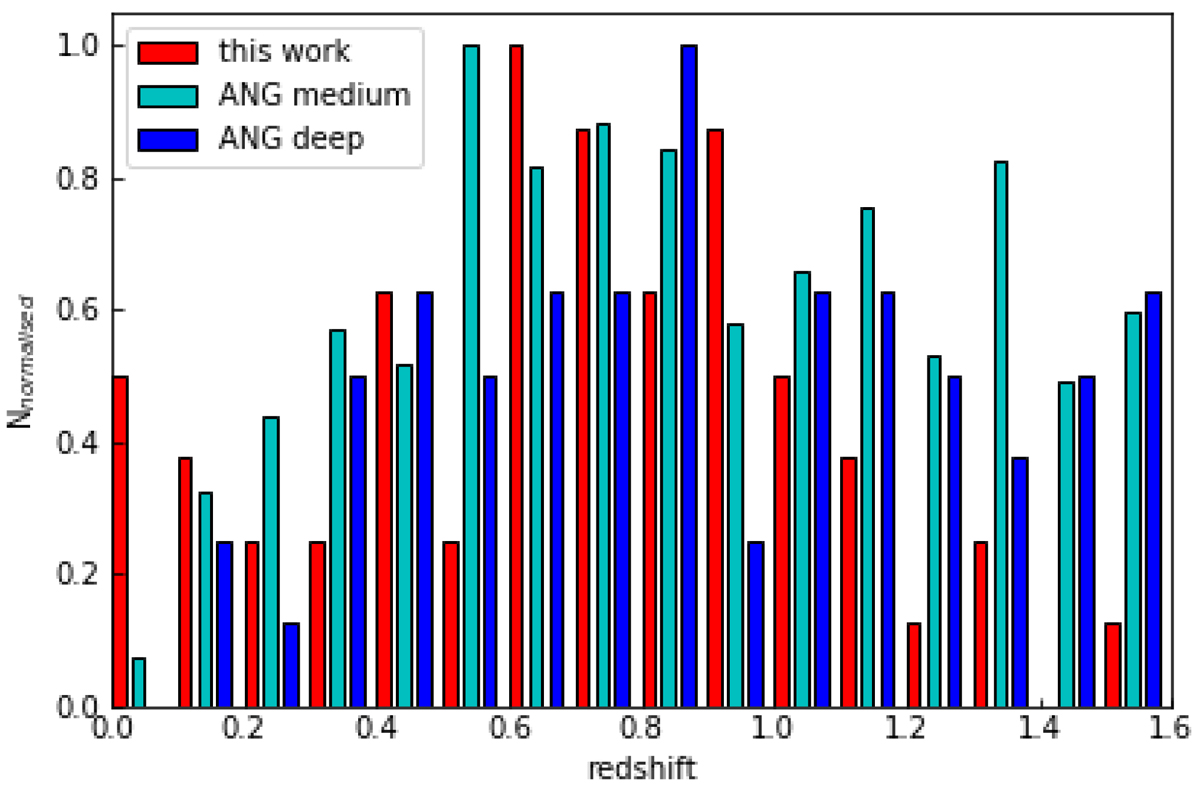
Normed histogram of the photometric redshift of our 56 polarised sources (red), compared to the deep (blue) and medium (cyan) simulations of Bonaldi et al. (2019), where we used a cutoff of 6.25 times our central RMS. We only include sources with flux densities comparable to those of our sample. We also normed the maximum of each sample to 1 in the histogram to allow different sample sizes to be compared with one another.
Current usage metrics show cumulative count of Article Views (full-text article views including HTML views, PDF and ePub downloads, according to the available data) and Abstracts Views on Vision4Press platform.
Data correspond to usage on the plateform after 2015. The current usage metrics is available 48-96 hours after online publication and is updated daily on week days.
Initial download of the metrics may take a while.