Free Access
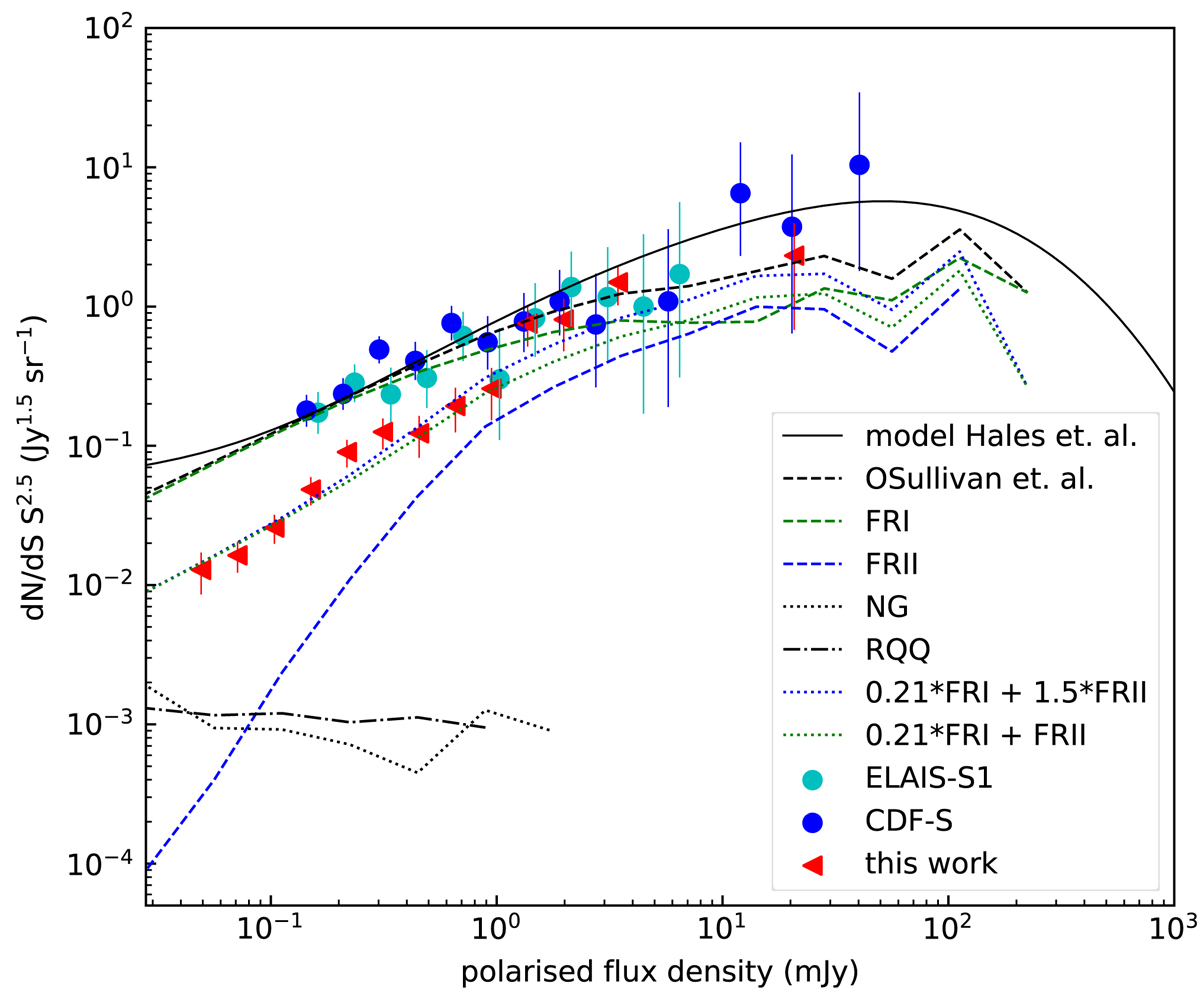
Fig. 15.
Download original image
Similar to Fig. 11, giving the Euclidian-normalised differential source counts. The additional curves are defined by the summation of the source counts from O’Sullivan et al. (2008), a1 ⋅ FR I + a2 ⋅ FR II, where for the green dotted line a1 = 0.21 and a2 = 1 and for the blue dotted line a1 = 0.21 and a2 = 1.5.
Current usage metrics show cumulative count of Article Views (full-text article views including HTML views, PDF and ePub downloads, according to the available data) and Abstracts Views on Vision4Press platform.
Data correspond to usage on the plateform after 2015. The current usage metrics is available 48-96 hours after online publication and is updated daily on week days.
Initial download of the metrics may take a while.