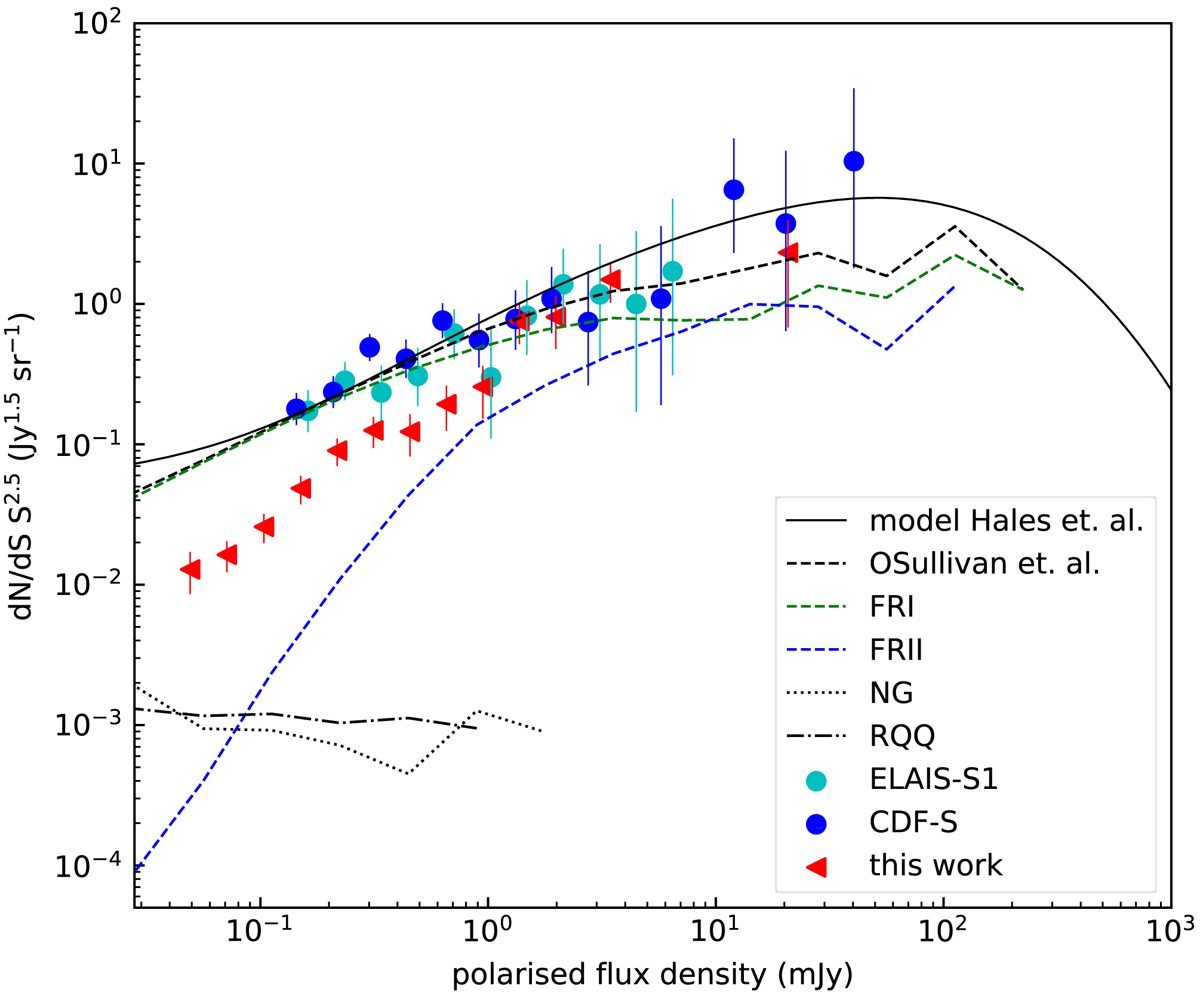
Fig. 11.
Download original image
Euclidian-normalised differential source counts at 1.4 GHz in polarised intensity from our Lockman Hole observations (red triangles). Component counts from Hales et al. (2014a) for CDF-S (blue) and ELAIS-S1 (turquoise) are given for comparison. The solid black line shows the model prediction from Hales et al. (2014a). The other lines are from the simulations of O’Sullivan et al. (2008); the dashed black line gives the total polarised differential source counts, the dashed green line gives the FR I source counts, and the blue one gives the FR II source counts. The black dotted line represents the NGs, and the dot-dashed black line the RQQs.
Current usage metrics show cumulative count of Article Views (full-text article views including HTML views, PDF and ePub downloads, according to the available data) and Abstracts Views on Vision4Press platform.
Data correspond to usage on the plateform after 2015. The current usage metrics is available 48-96 hours after online publication and is updated daily on week days.
Initial download of the metrics may take a while.