Free Access
Fig. 6.
Download original image
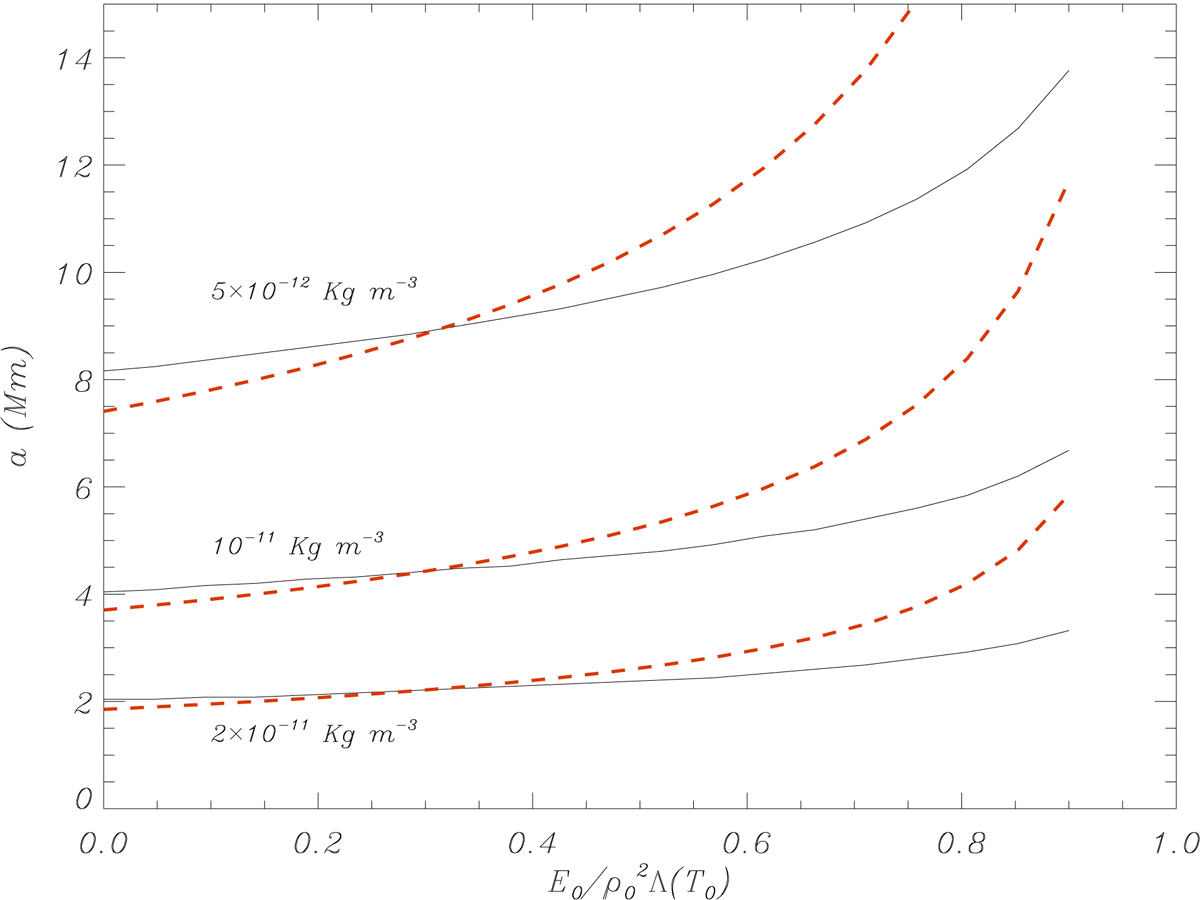
Thread length, a, as a function of the heating constant, E0, for different reference densities ρ0. In this plot the reference temperature is T0 = 8 × 10³ K, and Athay’s radiative loss is used. The analytical approximation given by Eq. (13) is plotted with red dashed lines. Model A is used in this plot.
Current usage metrics show cumulative count of Article Views (full-text article views including HTML views, PDF and ePub downloads, according to the available data) and Abstracts Views on Vision4Press platform.
Data correspond to usage on the plateform after 2015. The current usage metrics is available 48-96 hours after online publication and is updated daily on week days.
Initial download of the metrics may take a while.