Fig. 9.
Download original image
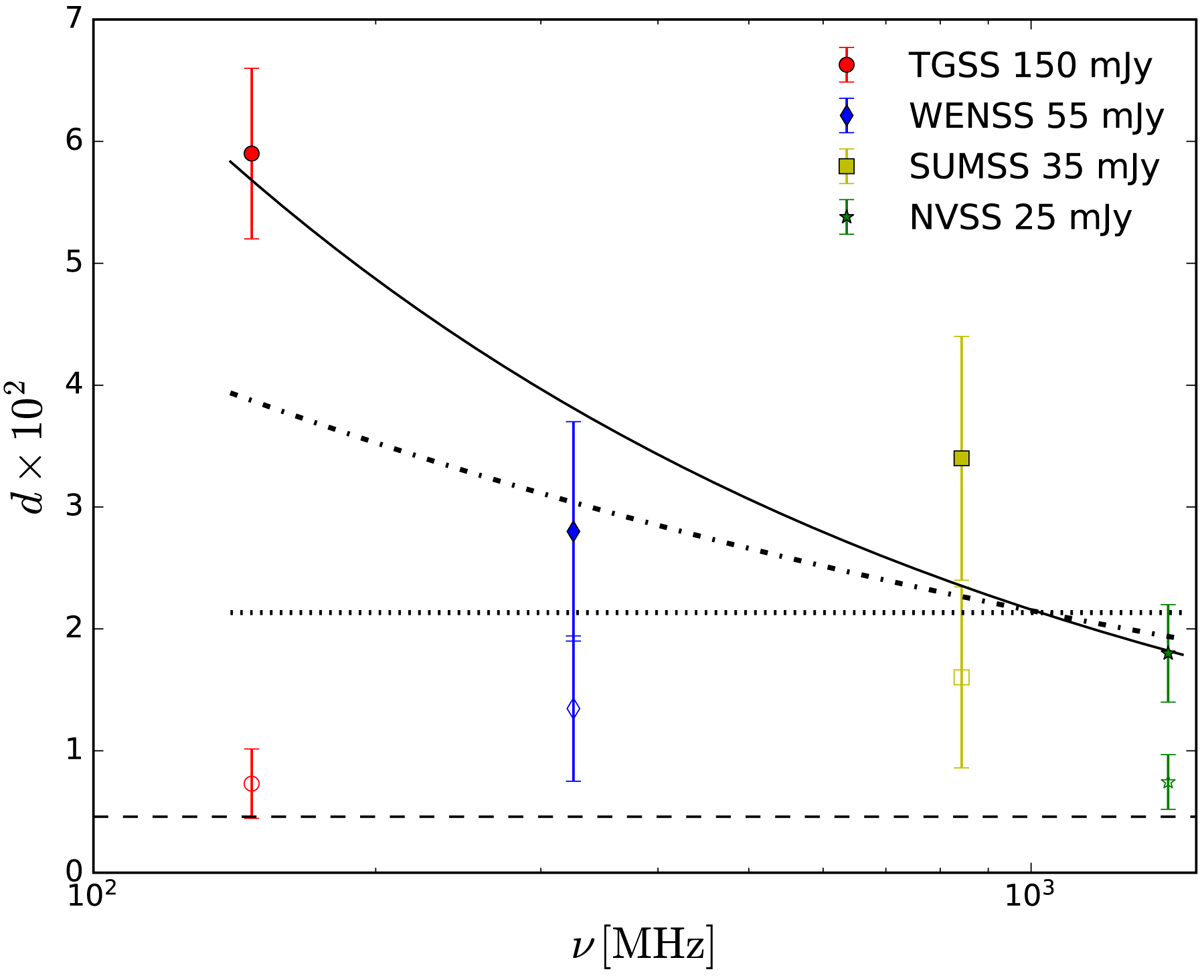
Comparison of dipole amplitudes observed at different frequencies for the TGSS-ADR1, WENSS, SUMSS, and NVSS masked with ‘mask d’. A function f(ν) = A(ν/1 GHz)m is fitted to the dipole amplitudes (solid lines), which results in A = (2.16 ± 0.53)×10−2 and m = −0.51 ± 0.15 with χ2/d.o.f. = 1.23. Results of a power law and constant dipole amplitude fit excluding the TGSS are shown as dashed-dotted and dotted lines, respectively. Simulations for each survey coverage with the CMB dipole (dashed line) are shown as open symbols.
Current usage metrics show cumulative count of Article Views (full-text article views including HTML views, PDF and ePub downloads, according to the available data) and Abstracts Views on Vision4Press platform.
Data correspond to usage on the plateform after 2015. The current usage metrics is available 48-96 hours after online publication and is updated daily on week days.
Initial download of the metrics may take a while.