| Issue |
A&A
Volume 653, September 2021
|
|
|---|---|---|
| Article Number | C1 | |
| Number of page(s) | 2 | |
| Section | The Sun and the Heliosphere | |
| DOI | https://doi.org/10.1051/0004-6361/202038925e | |
| Published online | 16 September 2021 | |
Exploring the coronal evolution of AR 12473 using time-dependent, data-driven magnetofrictional modelling⋆ (Corrigendum)
Department of Physics, University of Helsinki, Helsinki, Finland
e-mail: This email address is being protected from spambots. You need JavaScript enabled to view it.
Key words: Sun: coronal mass ejections (CMEs) / Sun: corona / magnetic fields / magnetic reconnection / methods: numerical / errata, addenda
Movie is available at https://www.aanda.org
Upon further analysis of the results of our paper, an error in the computation of the twist number Tw was discovered. As a result, the stated values of Tw in the original manuscript are incorrect, and have been recomputed.
The twist number Tw is a measure of the turns of two infinitesimally close magnetic field lines about each other and it was used to identify the flux rope in the simulation. The recomputation did not affect the description of the evolution of the flux rope nor the main results of the paper. However, while the core of the flux rope was previously found to be increasingly twisted with time (conclusion two), it is now found to be relatively constantly twisted. The core has a Tw value of approximately 1.4, but it varies from approximately between 1.3 and 1.5. Consequently, Figs. 5 and 7 have been re-plotted to display the correct values for Tw. The field lines shown in Fig. 5 now thread the Tw > 1.0 region instead of a Tw > 1.5 region. The movie depicting the evolution of Tw accompanying Fig. 5 has also been adjusted. The rest of the paper isunaffected.
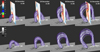 |
Fig. 5. Simulation excerpts from 11:36 UT on 28 December to 11:36 UT on 31 December with a spacing of 24 h between each image. Top row: flux rope for field lines where Tw > 1.0. It is bisected by a plane of Tw that also plots the contours of Tw. Bottom row: unobstructed view of the flux rope from the same angle. All plots include a plane of Bz at the lower boundary of the domain. The Tw and Bz planes are available as online movies. |
 |
Fig. 7. Simulation excerpts from 11:36 UT on 26 December to 11:36 UT on 29 December, with a spacing of 24 h between each image. The plane depicts the current density (purple to green), with approximately horizontal contours of decay index (red to green) and additional contours of Tw (blue and cyan). The plane is in the same position as the Tw plane in Fig. 5. |
In addition to the changes to Figs. 5 and 7, the following changes to the text are to be noted:
1. Section 3.3, paragraph two now reads:
Plots of the magnetic field lines are shown for every 24 h in Fig. 5, including a vertical plane and contours of Tw in the first row and an unobstructed view of the field lines in the second row. The flux rope field lines trace a region of the flux rope for which Tw > 1.0 (red contour). This contour is not a regular circle, but it is very coherent. The temporal evolution of the Tw and Bz planes from Fig. 5 are available as online movies.
2. Section 3.3, paragraph three now reads:
Additionally, Fig. 5 shows that the simulation generates a consistently positively twisted flux rope. Above the flux rope, the twist decreases and becomes slightly negative, as shown by the blue triangular region. This region and the flux rope itself are bordered by generally slightly positively twisted field lines. As time progresses, the flux rope rises and expands in diameter. The core has a Tw value of approximately 1.4 early into its formation, before falling to approximately 1.3 for three days, and then returning to 1.4 with two brief spikes to 1.5.
3. Section 3.4, paragraph two now reads:
Plots of the contours from the decay index are shown in Fig. 7, including a vertical plane of the magnetic field-normalised current density (the magnitude of J divided by the magnitude of B) and contours of Tw. The first panel shows, at 11:36 UT on 26December, a well-defined region of Tw > 1.0 within a region of increased current density, marking the location of the flux rope. Using the Tw contour in particular as an approximate boundary for the flux rope, we show that it formed close to the photosphere in a region where n < 1.0. In the second panel, at 11:36 UT on 27 December, the flux rope has risen and expanded and is approximately bisected by the n > 1.0 contour. In the third panel, at 11:36 UT on 28 December, the flux rope has risen and expanded further and is located within a region where 2.0 > n > 1.0. In the final panel, at 11:36 UT on 29 December, the Tw > 1.0 region making up the flux rope is almost entirely within the region where n > 1.5.
4. Section 4, conclusion two now reads:
The core of the flux rope has a relatively constant twist, with a Tw value of approximately 1.4, but it does vary from 1.3 to 1.5 as it rises.
Movie
Movie associated with Fig. 5 Access Supplementary Material
© ESO 2021
All Figures
|
Fig. 5. Simulation excerpts from 11:36 UT on 28 December to 11:36 UT on 31 December with a spacing of 24 h between each image. Top row: flux rope for field lines where Tw > 1.0. It is bisected by a plane of Tw that also plots the contours of Tw. Bottom row: unobstructed view of the flux rope from the same angle. All plots include a plane of Bz at the lower boundary of the domain. The Tw and Bz planes are available as online movies. |
| In the text | |
|
Fig. 7. Simulation excerpts from 11:36 UT on 26 December to 11:36 UT on 29 December, with a spacing of 24 h between each image. The plane depicts the current density (purple to green), with approximately horizontal contours of decay index (red to green) and additional contours of Tw (blue and cyan). The plane is in the same position as the Tw plane in Fig. 5. |
| In the text | |
Current usage metrics show cumulative count of Article Views (full-text article views including HTML views, PDF and ePub downloads, according to the available data) and Abstracts Views on Vision4Press platform.
Data correspond to usage on the plateform after 2015. The current usage metrics is available 48-96 hours after online publication and is updated daily on week days.
Initial download of the metrics may take a while.