| Issue |
A&A
Volume 652, August 2021
|
|
|---|---|---|
| Article Number | A40 | |
| Number of page(s) | 7 | |
| Section | Planets and planetary systems | |
| DOI | https://doi.org/10.1051/0004-6361/202141581 | |
| Published online | 06 August 2021 | |
Granular mechanics simulations of collisions between chondritic aggregates
Physics Department and Research Center OPTIMAS, University Kaiserslautern, Erwin-Schrödinger-Straße,
67663
Kaiserslautern,
Germany
e-mail: This email address is being protected from spambots. You need JavaScript enabled to view it.
Received:
18
June
2021
Accepted:
18
July
2021
Abstract
Context. Collisions of dust aggregates are relevant for the evolution of protoplanetary disks.
Aims. While in the past interest focused on aggregates composed of monodisperse grains, here we study the collision of chondritic aggregates, in which – besides a majority of dust grains – larger chondrules are embedded.
Methods. We use granular-mechanics simulations to study collisions of chondritic aggregates.
Results. Low-velocity collisions lead to pancake-shaped deformations of the fused cluster accompanied by a compaction of the dust grains. Higher collision velocities fragment the aggregates. While some chondrules are almost laid bare after the collision, we find that the largest fragments typically contain chondrules; large fragments thus capture chondrules. Grain compaction is accompanied by an increase in grain – chondrule contacts and is maximum for intermediate velocities, just before aggregates start fragmenting.
Conclusions. The presence of chondrules considerably influences the fragmentation behavior of dust aggregates.
Key words: planets and satellites: formation / protoplanetary disks / methods: numerical
© ESO 2021
1 Introduction
The evolution of protoplanetary disks is governed to a large extent by the dynamics of dust particles (Birnstiel et al. 2010), which can agglomerate to form larger aggregates (Blum 2010). Collisions between aggregates are responsible for the evolution of the disk and – in the long term – for the formation of larger bodies (planetesimals). Depending on the collision velocity, but also on the size and porosity of the aggregates, collisions can have various outcomes, ranging from total disruption to aggregate growth; see e.g., Blum & Wurm (2008) for a review.
In simulation studies, aggregates are often assumed to consist of spherical grains of a single size (Wada et al. 2008, 2011; Ringl et al. 2012a). In protoplanetary disks, grain size distributions differ significantly from such a monodisperse distribution and are expected to follow a power law (Mathis et al. 1977) – see also Zubko et al. (1996) – but the effects on aggregate collisions appear to be minor as long as they are compared to a monodisperse distribution with a suitably defined size (Umstätter & Urbassek 2020).
A particular type of aggregate is formed by chondrites: aggregates of dust grains containing silicate spherules denoted as chondrules. Chondrites have been estimated to make up over 85% of all meteorites (Bevan 1992; Koeberl et al. 1992; Bischoff & Geiger 1995). According to the most accepted model, chondrules form as a result of impacts of planetesimals (Johnson et al. 2015; Hasegawa et al. 2016; Wakita et al. 2017) and subsequent cooling (Dullemond et al. 2014). While such chondrules may be initially naked, they get dressed in the surrounding dust disk by dust grains (Ormel et al. 2008), and thus chondritic aggregates may form containing several chondrules embedded in a matrix of dust grains. Important information about young protoplanetary disks and mass transport therein can be gained from chondrites (van Kooten et al. 2021). Collisions between chondritic aggregates only appear to have been studied up to now in the simplified case of single chondrules covered by dust grains (Ormel et al. 2008; Gunkelmann et al. 2017; Umstätter et al. 2019). Such studies have shown that the dust cover of chondrules helps them to stick upon collision, allowing them to grow into larger bodies containing multiple chondrules. In addition, collisions of hard impactors on chondritic material (Beitz et al. 2013), or of chondrules with matrix material (Machii et al. 2013), have been performed.
In the present study, we consider collisions between chondritic aggregates. In a simple model, such aggregates may be considered to be composed of monodisperse dust grains (in the following, simply denoted ‘grains’) into which several chondrules are embedded. Using a granular mechanics model for simulating the dynamics of these aggregates during the collision, we focus on the aggregation and fragmentation behavior of such aggregates and on the collision-induced compaction.
2 Methods
2.1 Granular mechanics model
The model used here is based on the work of Dominik & Tielens (1997) and has been implemented (Ringl & Urbassek 2012; Gunkelmann et al. 2016) in the molecular dynamics software LAMMPS (Plimpton 1995) and in the open-source code LIGGGHTS (Kloss et al. 2012). It uses the effective radius,
 (1)
(1)
of two particles in contact and their overlap,
 (2)
(2)
The mechanical properties are taken as appropriate to silica: a surface energy γ = 0.05 J m−2, Young’s modulus Y = 27 GPa, and the Poisson ratio ν = 0.17. The granular mechanics model calculates normal forces with an adhesive contribution (Derjaguin et al. 1975),
 (3)
(3)
an elastic contribution according to Hertzian theory,
 (4)
(4)
and a viscous component,
 (5)
(5)
depending on the normal component, vn, of the contact velocity, with A = 0.5 ns. A relative tangential motion of the grains induces a sliding force,
 (6)
(6)
as well as the resulting torque, a rolling torque,
 (7)
(7)
with ξyield = 3.2 nm (Heim et al. 1999), and a twisting torque,
 (8)
(8)
In the interest of brevity here, we refer the reader to the more thorough discussion by Ringl & Urbassek (2012).
In the present study, we use spherical grains of radius rgrain = 0.76 μm, which is the size used in laboratory experiments (Blum et al. 2006), and chondrules of radius rchond = 5 μm, both of them consisting of the same material, namely silica. Grains and chondrules have masses of mgrain = 3.68 × 10⁻¹⁵ kg and mchondrule = 1.05 × 10⁻¹² kg, respectively. In comparison to realistic chondrules, whose typical radii are of the order of 0.1– 1 mm (Friedrich et al. 2015), our chondrule radii are more than one order of magnitude smaller. We do this because realistically sized chondrules would increase the simulated volume (and the number of particles) by at least three orders of magnitude, which is not feasible with current computational resources; see also the discussion by Umstätter et al. (2019).
Using this model in a simple two-grain experiment, it is easy to find the minimum velocity vfrag needed to separate two grains in contact. We find vfrag= 0.3808 m s−1. This is larger than the value found by Ringl & Urbassek (2012), as we use different material properties here.
2.2 Building aggregates
We build aggregates that consist of five chondrules embedded in a homogeneous background of dust grains. This is not entirely trivial and we proceed as follows. First a shell of grains is constructed around each chondrule according to the algorithm given by Umstätter et al. (2019), which is based on ballistic deposition. We then bring a dust-covered chondrule in contact with another one (shell–shell contact). The new chondrule is rotated around the center of the grain of the old dust rim until a second contact between the two shells has been formed. The positions of the two grains to which the new chondrule is attached define an axis around which we perform another rotation until a third contact between the old and new chondrule has formed. This procedure is repeated with three further dust-covered chondrules and we then have an aggregate with five chondrules connected via grain contacts. The idea to rotate aggregates is also used by Morán et al. (2019). In the next step, the aggregate center, xc, is calculated as the average position of all particles and the radius of this aggregate as  , with particle radius ri. This allows us to calculate the volume of the sphere as well as the already filled volume. As we request that the aggregates obey pre-defined values of the filling factors, we can calculate the number of grains that need to be added to the aggregate in order to reach this filling factor. We attach a part of this number of grains to already existing grains in a random direction. If the newly placed grain does not overlap with existing grains and is completely inside the sphere, we keep it. Another part of the grains is added to the aggregate by quasi-ballistic deposition.
Using this algorithm, we produce three aggregates with filling factors ϕ = 0.2, 0.25, and 0.3, respectively. The radius of the aggregates amounts to Rcluster = 24 μm, and the number of grains varies between roughly N0 = 6000 and 9000 according to the filling factor; see Table 1. Here, the total number of grains in one aggregate is denoted by N0; hence the total number of grains in one simulation is 2N0. Figure 1 shows such a chondrite aggregate with five chondrules and a grain filling factor of ϕ = 0.25.
Number of grains, N0, and masses, Mcluster, of the aggregates for the filling factors ϕ studied.
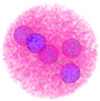 |
Fig. 1 Chondrite aggregate with five chondrules and a filling factor of ϕ = 0.25. Grains and chondrules are transparent to enable the visibility of the chondrules. |
2.3 Collision simulation
To start the simulations, we use two copies of the same aggregate and randomly rotate them around their center of mass. Only central collisions are considered, in which the velocity vector is directed along the collision axis, which joins the center of mass of the two colliding aggregates. We perform three simulations per filling factor and collision velocity with randomly rotated aggregates in order to enhance statistics. We perform collisions for velocities in the range from 2.5 to 25 m s−1 with steps of 2.5 m s−1. All collisions studied here are between aggregates with the same filling factor and with an impact parameter b = 0 (head-on collisions). Simulations are run up to a time of more than 100 μs after the collision.
3 Results and discussion
3.1 Fragmentation statistics
Figure 2 shows a time-series of snapshots of a collision at v = 25 m s−1, spaced by 10 μs. In a side view, the collided aggregates would deform into a thin pancake-like structure, and so we show a view along the collision axis. The figure demonstrates that at this velocity, the collided aggregates break into multiple fragments, which spread in the plane perpendicular to the collision axis. Many single grains (monomers) can be observed next to a smaller number of big fragments that contain more than 50% of the mass. Most of the bigger fragments – four in this collision – contain at least one chondrule. However, three chondrules show up almost naked in the last snapshot shown in Fig. 2.
To quantify these observations more thoroughly, we determine the distribution f(N) of the number of grains, N, present in the fragments at the end of the simulation. Figure 3 shows this distribution for the collision visualized in Fig. 2 for fragments containing at least one chondrule (Fig. 3a) and for fragments without chondrules (Fig. 3b). In both cases, the distribution peaks at small grain numbers; this peak is particularly sharp for chondrule-free fragments, where the first bin contains only monomers and the second only dimers. As the number of chondrules per collision is only ten, the statistics of the chondrule-containing fragments, Fig. 3a, is poorer. However, we see that the distribution extends to considerably larger fragments and only terminates at N = 2500, while the chondrule-free fragments contain 1000 grains at most. In addition, a weak second maximum for grain numbers around 1500 is observed. These findings indicate that large fragments stabilize the chondrules. As seen in Fig. 2, several chondrules also show up almost naked; these chondrules are contained in the first bin in Fig. 3a and represent the maximum of the distribution. This is in agreement with recent simulations (Umstätter et al. 2019) of collisions between dust-covered chondrules which show that chondrules tend to shed surrounding dust particles.
The fragment-size distribution of chondrule-free fragments, Fig. 3b, shows in its main part, that is, for N = 10–100, a power-law decay, f(N)∝ N−τ, with an exponent of τ = 0.94. For smaller sizes, the decay is steeper, τ = 2.07, but stagnates for larger N > 100 (τ = 0.27). The overall exponent is τ = 0.84. Such (partly) power-law-like distributions have been found previously in studies of monodisperse aggregate collisions (Ringl et al. 2012a), where decays corresponding to τ ~ 2 were found. We also interpret the slower decay found in the size distribution of chondrule-free fragments to be caused by the preferred location of chondrules in the large fragments.
In order to make a more detailed comparison to the results by Ringl et al. (2012a), we note that the collision velocity of v = 25 m s−1 corresponds to v = 66vfrag. For velocities in the range of 29 ≤ v∕vfrag ≤ 118, Ringl et al. (2012a) reported a power-law exponent of τ = 1.9–2.0 at the low-mass end of their fragment distribution. For N ≤ 10, we find a power-law exponent τ = 2.31 for the collisions at v = 15 m s−1 (v∕vfrag = 39), Fig. 3c. For v = 5 m s−1 (v∕vfrag = 13), Fig. 3d, we find τ to be significantly larger (τ = 3.13). At this low velocity, fragmentation has not really set in, as most of the aggregate mass is found in the merged collided aggregate, and only a few monomers – and even fewer small clusters – are ejected.
The distributions of chondrule-free fragments and chondrule-containing fragments are not mathematically independent, as they describe the outcomes of the same collision. As chondrules preferably stay in large fragments, those fragments then do not appear in the chondrule-free statistics; smaller fragments hence dominate this statistics even more than in monodisperse aggregate collisions such as those simulated by Ringl et al. (2012a). However, our data basis does not allow us to rule out the possibility of still another mechanism: chondrules themselves may become active in fragmenting the matrix into small fragments, thus increasing the number of small chondrule-free fragments beyond that in monodisperse aggregates.
While these distributions were obtained for a specific case, v = 25 m s−1 and ϕ = 0.25, Fig. 4 demonstrates that these findings are valid for all velocities and filling factors studied. Figure 4 shows the average aggregate sizes of chondrule-containing (Fig. 4a) and chondrule-free (Fig. 4b) fragments. The average size of chondrule-free fragments is rather stable throughout all velocities – it only increases slightly from 1 to 3.5 in the velocity range investigated here, demonstrating that the grain-size distribution is dominated by the pronounced maximum at small N; see Fig. 3b. However, the average fragment size of chondrule-containing fragments changes considerably – by a factor of ten – in the velocity range studied. For velocities below around 10–12.5 m s−1, the collided aggregate shows only little fragmentation, such that more than 80% of the grains remain in the collided aggregate. Towards the highest velocities studied, v = 25 m s−1, the collided aggregate strongly fragments (see Fig. 2) such that the average number of grains aggregated around a chondrule sinks to only around 5.5%. Thus, even at v = 25 m s−1, the average grain number of chondrule-containing fragments is higher by a factor of roughly 300 than in fragments without chondrules. We note that porous aggregates, ϕ = 0.2, tend to fragment at somewhat smaller velocities than aggregates with higher filling factor.
Figure 5 displays the average number of chondrules contained in the most massive fragment normalized by the total number (i.e., 10) of chondrules in the simulation. The most massive fragment contains all chondrules for collision velocities ≤10 m s−1. Only above this velocity are chondrules observed outside of the most massive fragment. This is a higher velocity than the bouncing velocities of two dust-covered chondrules, which amounts to 4–7.5 m s−1 (Umstätter et al. 2019). This indicates that the larger number of grains in the aggregates allows stronger energy dissipation and impedes fragmentation as compared with the thin dust shell of the chondrules considered by Umstätter et al. (2019).
At high velocities, chondrules are found outside the largest fragment. In order to define a critical velocity above which chondrules leave the collided aggregate, we use a threshold fraction of 0.5 in Fig. 5, which occurs at a relatively high velocity, at roughly 17.5 m s−1. At this high velocity, the number of grains in the largest fragment has already fallen to only 20% of the total grain number; see Fig. 4a. This corroborates our finding that for chondrules to be ejected, they have to lose a significant amount of the dust that surrounds them.
Even at the highest velocity studied, the relative number of chondrules does (on average) not sink below 0.2 in our simulation. In our simulations we do not observe a high number of very massive aggregates consisting only of grains. Ejection of chondrules reduces the masses of fragments significantly. Moreover, as can be seen in Fig. 3, the chondrule-containing fragments with the highest number of grains have more than twice as many grains as the ones without chondrules. It may therefore be concluded that, in the velocity range probed in this study, the ejection of chondrules coincides with stronger fragmentation of the left-over fragment.
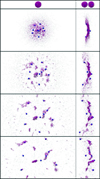 |
Fig. 2 Snapshots of a collision with initial filling factor ϕ = 0.25 and a collision velocity v = 25 m s−1. Snapshots are spaced by 10 μs. On the left-hand side, the collision is viewed along the collision axis; on the right-hand side we show the same collision from the side. |
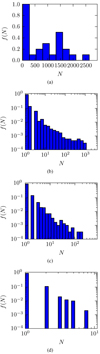 |
Fig. 3 Grain number distributions of fragments (a) with and (b) without chondrules in our fastest collisions, v = 25 m s−1. Panels c and d: histograms for chondrule-free fragments at velocities 15 and 5 m s−1, respectively. We note the change in abscissa scale in the subpanels. Histograms have been normalizedsuch that the first bin reaches a value of one. All data are for an initial filling factor ϕ = 0.25. |
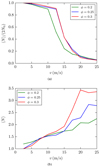 |
Fig. 4 Average number of grains in fragments (a) with and (b) without chondrules vs. collision velocity v. Data in (a) are normalized to the total number of grains, 2N0. Values in (a)can reach up to (almost) 1 for sticking collisions. |
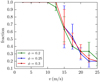 |
Fig. 5 Fraction of all chondrules contained in the largest fragment. |
3.2 Coordination number
Aggregate compaction is most easily analyzed by considering the average number of contacts per grain, which we denote as the coordination number Z. Because of the nature of our ballistic aggregate construction algorithm, the coordination number of our aggregates is initially around two (Wada et al. 2011).
Figure 6 shows the coordination number of grain–grain contacts in the most massive fragment (irrespective of chondrule content). The coordination number reaches a maximum in a range of 5–12.5 m s−1 and drops off at higher velocities. Even at the lowest velocities studied, Z has increased considerably above its original value of two. This is caused by the compression of the material during the collision, which allows grains to increase their number of contacts. The coordination number starts decreasing at around v = 12.5 m s−1, that is, as soon as fragmentation sets in. This is caused by the decreasing size of fragments discussed above, because surface grains are systematically under-coordinated with respect to bulk grains. At higher filling factors, the fragments reach higher coordination numbers – even though the initial coordination number is the same – because more grains are available around each grain to form new contacts. We conclude that during the fragmentation process the granular matter gets compressed to increase its coordination number. The drop-off of the coordination number towards higher collision velocities can be explained by the fact that more collisional energy is available to break contacts as well as the resulting smaller size of fragments not allowing for higher coordination numbers.
Figure 7 shows the average number of contacts per chondrule normalized by its initial value, which amounts to 72.7 on average. At low collision velocities, v ≤ 5 m s−1, chondrules can form additional contacts with grains because of the collision-induced compression discussed above; Fig. 6. Towards high velocities, chondrules lose more than half of their contacts at a collision velocity of 25 m s−1. The numberof contacts drops already before fragmentation sets in by around 10–20%, indicating that a minimum number of contacts hasto be broken for fragmentation to set in. Again, a lower filling factor reduces the number of contacts after the collision, forsimilar reasons as for grain-grain contacts; Fig. 6. At lower filling factors there are less grains around the chondrules that can form new contacts and dissipate collision energy.
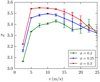 |
Fig. 6 Coordination number, Z, of grain–grain contacts in the most massive fragment plotted against the collision velocity. |
3.3 Comparison to a model by Arakawa
Recently, Arakawa (2017) set up a model of chondrite collisions, in which it is assumed that the grain matrices are immediately stopped upon colliding without changing their shape. Chondrules are set free of all grains if their velocity is large enough to penetrate the matrix material. Using macroscopic stopping laws, Arakawa (2017) calculates the penetration depth L of chondrules in granular material and can thus predict the collision velocity vc at which L exceeds the aggregate radius Rcluster and hence all chondrules are set free. Applying his formulae to our case, his model predicts vc = 0.687 (0.961, 1.265) m s−1 for filling factors ϕ = 0.2, (0.25, 0.3). This is evidently in stark contrast to our simulations, where chondrules are only set free at velocities ≳ 10 m s−1.
In order to understand the failure of Arakawa’s model in the present case, we determined the penetration depth of our chondrules into a granular target (ϕ = 0.3) and found L = 6.6 μm for v = 5 m s−1 and L = 17.6 μm at v = 15 m s−1; these lengths are considerably smaller than in Arakawa’s model. We note that these lengths are even smaller than the aggregate radius Rcluster = 24 μm; however, due to the collision-induced deformation of the aggregates, chondrules can escape the aggregate at the higher velocity. Our results for the penetration depth are in good agreement with previous impact simulations by Ringl et al. (2012b). We conclude that Arakawa’s formulae for chondrule stopping give overly large values in comparison to granular simulations.
In addition, Arakawa’s model is over-simplified in that the collision-induced deformation of the matrix is not taken into account. In reality, the merged aggregates do not retain their original form, but are strongly distorted to a pancake-like shape, as has been observed in several simulations of granular aggregates (Paszun & Dominik 2009; Ringl et al. 2012a). Such a deformation helps the ejection of chondrules because even smaller penetration lengths L < Rcluster will set them free. Thus, the model of an instantaneously stopped but undeformed matrix through which the chondrules may penetrate with the collision velocity appears over-simplified.
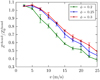 |
Fig. 7 Average number of contacts per chondrule, Zchond, normalized by the initial value, |

4 Conclusions
We used granular mechanics simulations to study collisions between chondritic aggregates. These are composed of massive chondrules embedded in a matrix of small dust grains. Low-velocity collisions between such aggregates lead to pancake-shaped deformations of the fused cluster accompanied by a compaction of the dust grains. Higher collision velocities fragment the aggregates. While some chondrules are almost laid bare after the collision, we find that the largest fragments typically contain chondrules; large fragments thus capture chondrules. Grain compaction is accompanied by an increase of grain-chondrule contacts and is maximum for intermediate velocities, just before aggregates start fragmenting.
While collisions of chondritic aggregates have only rarely been studied (Arakawa 2017), the collisional fragmentation of monodisperse aggregates has been investigated based on the simple picture (Dominik & Tielens 1997; Blum & Wurm 2000) that the collisional fragmentation of monodisperse aggregates can be discussed by the ratio β = E∕Esep of the collision energy E and the total separation energy Esep of the aggregate where Esep = NcEbreak is given by the number of contacts, Nc, in the aggregate and the break-up energy Ebreak of a single contact. Increasing β leads to a stronger fragmentation of the aggregate. Using this quantity, the fragmentation of chondrule-containing aggregates differs from that of monodisperse aggregates by the following features:
The break-up energy increases with the effective radius, reff, of the contacting grains as
 (Chokshi et al. 1993; Dominik & Tielens 1997; Umstätter et al. 2019). As for a chondrule–grain contact reff = 0.66 μm and for a grain–grain contact reff = 0.38 μm, the effect of adhesive forces impedes fragmentation in chondritic aggregates by a factor of 2.1.
The number of contacts of a chondrule is around 72, while it is initially 2 for grains. The ratio of these numbers is close to the ratio of surface areas of chondrules and grains. The number of contacts thus strongly increases the separation energy of a chondrule as compared to that of a grain, by a factor of around 36.
The collisional energy of the colliding aggregates is shared by the constituents according to their mass. As chondrules are by afactor of 285 more massive than grains, this mass effect is dominating and predicts that chondrules will easily be set free in a collision (Arakawa 2017). This was indeed observed in recent simulations (Gunkelmann et al. 2017; Umstätter et al. 2019) of colliding dust-covered chondrules which tend to shed off their dust shells. Also, in the present simulations, a number of chondrules are found that are free of grains; Fig. 2.
A recent re-evaluation (Umstätter & Urbassek 2021) of aggregate fragmentation proposes the use of β′ = E∕(N2∕3Esep) rather than β =E∕Esep for assessing aggregate fragmentation, giving weight to the fact that in larger aggregates, collisional energy is dissipated before it can lead to fragmentation. The additional factor N−2∕3 in the recently introduced parameter β′ emphasizes our argument that dressed chondrules will survive mainly in larger fragments and explains the bimodal distribution of Fig. 3a. A recent analysis of chondrules found in chondritic meteorites showed that part of the chondrules feature accretionarydust rims, while others are without this feature (Simon et al. 2018). Our study shows that this diversity in chondrule rims may be caused by the collisional history of chondrules or chondritic aggregates. Our main finding in this respect is that collisions between chondritic aggregates may lay chondrules bare and thus produce nonrimmed chondrules; however, a fraction of chondrules also emerge from such collisions still covered by rims.
The bimodal grain distribution used in the present study – a few large chondrules embedded in a matrix of smaller dust grains – is a simple model of an aggregate composed of a polydisperse grain distribution. Even in the absence of chondrules, dust aggregates in space are not monodisperse, but obey a power-law distribution (Mathis et al. 1977). Simulation studies have pointed out that the collisional behavior of such aggregates can be approximated by monodisperse aggregates with a suitably chosen radius (Ormel et al. 2009; Umstätter & Urbassek 2020). Our present study goes beyond these comparisons by showing that the chondrule content in large aggregates affects the aggregate stability in collisions and the sizes of fragments that are created.
Acknowledgements
Simulations were performed at the High Performance Cluster Elwetritsch (RHRK, TU Kaiserslautern, Germany).
References
- Arakawa, S. 2017, ApJ, 846, 118 [NASA ADS] [CrossRef] [Google Scholar]
- Beitz, E., Güttler, C., Nakamura, A., Tsuchiyama, A., & Blum, J. 2013, Icarus, 225, 558 [NASA ADS] [CrossRef] [Google Scholar]
- Bevan, A. 1992, Records of the Australian Museum, Supplement, 15, 1 [CrossRef] [Google Scholar]
- Birnstiel, T., Dullemond, C. P., & Brauer, F. 2010, A&A, 513, A79 [NASA ADS] [CrossRef] [EDP Sciences] [Google Scholar]
- Bischoff, A., & Geiger, T. 1995, Meteoritics, 30, 113 [CrossRef] [Google Scholar]
- Blum, J. 2010, Res. Astron. Astrophys., 10, 1199 [NASA ADS] [CrossRef] [Google Scholar]
- Blum, J., & Wurm, G. 2000, Icarus, 143, 138 [NASA ADS] [CrossRef] [Google Scholar]
- Blum, J., & Wurm, G. 2008, ARA&A, 46, 21 [Google Scholar]
- Blum, J., Schräpler, R., Davidsson, B. J. R., & Trigo-Rodriguez, J. M. 2006, ApJ, 652, 1768 [NASA ADS] [CrossRef] [Google Scholar]
- Chokshi, A., Tielens, A. G. G. M., & Hollenbach, D. 1993, ApJ., 407, 806 [NASA ADS] [CrossRef] [Google Scholar]
- Derjaguin, B. V., Muller, V. M., & Toporov, Y. P. 1975, J. Colloid Interface Sci., 53, 314 [Google Scholar]
- Dominik, C., & Tielens, A. G. G. M. 1997, ApJ, 480, 647 [NASA ADS] [CrossRef] [Google Scholar]
- Dullemond, C. P., Stammler, S. M., & Johansen, A. 2014, ApJ, 794, 91 [NASA ADS] [CrossRef] [Google Scholar]
- Friedrich, J. M., Weisberg, M. K., Ebel, D. S., et al. 2015, Geochemistry, 75, 419 [NASA ADS] [CrossRef] [Google Scholar]
- Gunkelmann, N., Ringl, C., & Urbassek, H. M. 2016, Comp. Part. Mech., 3, 429 [CrossRef] [Google Scholar]
- Gunkelmann, N., Kataoka, A., Dullemond, C. P., & Urbassek, H. M. 2017, A&A, 599, L4 [NASA ADS] [CrossRef] [EDP Sciences] [Google Scholar]
- Hasegawa, Y., Wakita, S., Matsumoto, Y., & Oshino, S. 2016, ApJ, 816, 8 [CrossRef] [Google Scholar]
- Heim, L.-O., Blum, J., Preuss, M., & Butt, H.-J. 1999, Phys. Rev. Lett., 83, 3328 [NASA ADS] [CrossRef] [Google Scholar]
- Johnson, B. C., Minton, D. A., Melosh, H. J., & Zuber, M. T. 2015, Nature, 517, 339 [NASA ADS] [CrossRef] [Google Scholar]
- Kloss, C., Goniva, C., Hager, A., Amberger, S., & Pirker, S. 2012, Prog. Comput. Fluid Dyn., 12, 140 [Google Scholar]
- Koeberl, C., Delisle, G., & Bevan, A. 1992, Die Geowissenschaften, 10, 220 [Google Scholar]
- Machii, N., Nakamura, A. M., Güttler, C., Beger, D., & Blum, J. 2013, Icarus, 226, 111 [CrossRef] [Google Scholar]
- Mathis, J. S., Rumpl, W., & Nordsieck, K. H. 1977, ApJ, 217, 425 [NASA ADS] [CrossRef] [Google Scholar]
- Morán, J., Fuentes, A., Liu, F., & Yon, J. 2019, Comput. Phys. Commun., 239, 225 [CrossRef] [Google Scholar]
- Ormel, C. W., Cuzzi, J. N., & Tielens, A. G. G. M. 2008, ApJ, 679, 1588 [NASA ADS] [CrossRef] [Google Scholar]
- Ormel, C. W., Paszun, D., Dominik, C., & Tielens, A. G. G. M. 2009, A&A, 502, 845 [NASA ADS] [CrossRef] [EDP Sciences] [Google Scholar]
- Paszun, D., & Dominik, C. 2009, A&A, 507, 1023 [NASA ADS] [CrossRef] [EDP Sciences] [Google Scholar]
- Plimpton, S. 1995, J. Comput. Phys., 117, 1 [Google Scholar]
- Ringl, C., & Urbassek, H. M. 2012, Comput. Phys. Commun., 183, 986 [NASA ADS] [CrossRef] [Google Scholar]
- Ringl, C., Bringa, E. M., Bertoldi, D. S., & Urbassek, H. M. 2012a, ApJ, 752, 151 [NASA ADS] [CrossRef] [Google Scholar]
- Ringl, C., Bringa, E. M., & Urbassek, H. M. 2012b, Phys. Rev. E, 86, 061313 [NASA ADS] [CrossRef] [Google Scholar]
- Simon, J. I., Cuzzi, J. N., McCain, K. A., et al. 2018, Earth Planet. Sci. Lett., 494, 69 [CrossRef] [Google Scholar]
- Umstätter, P., & Urbassek, H. M. 2020, A&A, 633, A24 [CrossRef] [EDP Sciences] [Google Scholar]
- Umstätter, P., & Urbassek, H. M. 2021, Granular Matter, 23, 33 [CrossRef] [Google Scholar]
- Umstätter, P., Gunkelmann, N., Dullemond, C. P., & Urbassek, H. M. 2019, MNRAS, 483, 4938 [NASA ADS] [Google Scholar]
- van Kooten, E., Schiller, M., Moynier, F., et al. 2021, ApJ, 910, 70 [CrossRef] [Google Scholar]
- Wada, K., Tanaka, H., Suyama, T., Kimura, H., & Yamamoto, T. 2008, ApJ, 677, 1296 [NASA ADS] [CrossRef] [Google Scholar]
- Wada, K., Tanaka, H., Suyama, T., Kimura, H., & Yamamoto, T. 2011, ApJ, 737, 36 [Google Scholar]
- Wakita, S., Matsumoto, Y., Oshino, S., & Hasegawa, Y. 2017, ApJ, 834, 125 [CrossRef] [Google Scholar]
- Zubko, V. G., Kreiowski, J., & Wegner, W. 1996, MNRAS, 283, 577 [NASA ADS] [CrossRef] [Google Scholar]
All Tables
Number of grains, N0, and masses, Mcluster, of the aggregates for the filling factors ϕ studied.
All Figures
|
Fig. 1 Chondrite aggregate with five chondrules and a filling factor of ϕ = 0.25. Grains and chondrules are transparent to enable the visibility of the chondrules. |
| In the text | |
|
Fig. 2 Snapshots of a collision with initial filling factor ϕ = 0.25 and a collision velocity v = 25 m s−1. Snapshots are spaced by 10 μs. On the left-hand side, the collision is viewed along the collision axis; on the right-hand side we show the same collision from the side. |
| In the text | |
|
Fig. 3 Grain number distributions of fragments (a) with and (b) without chondrules in our fastest collisions, v = 25 m s−1. Panels c and d: histograms for chondrule-free fragments at velocities 15 and 5 m s−1, respectively. We note the change in abscissa scale in the subpanels. Histograms have been normalizedsuch that the first bin reaches a value of one. All data are for an initial filling factor ϕ = 0.25. |
| In the text | |
|
Fig. 4 Average number of grains in fragments (a) with and (b) without chondrules vs. collision velocity v. Data in (a) are normalized to the total number of grains, 2N0. Values in (a)can reach up to (almost) 1 for sticking collisions. |
| In the text | |
|
Fig. 5 Fraction of all chondrules contained in the largest fragment. |
| In the text | |
|
Fig. 6 Coordination number, Z, of grain–grain contacts in the most massive fragment plotted against the collision velocity. |
| In the text | |
|
Fig. 7 Average number of contacts per chondrule, Zchond, normalized by the initial value, |
| In the text | |
Current usage metrics show cumulative count of Article Views (full-text article views including HTML views, PDF and ePub downloads, according to the available data) and Abstracts Views on Vision4Press platform.
Data correspond to usage on the plateform after 2015. The current usage metrics is available 48-96 hours after online publication and is updated daily on week days.
Initial download of the metrics may take a while.