Fig. 9
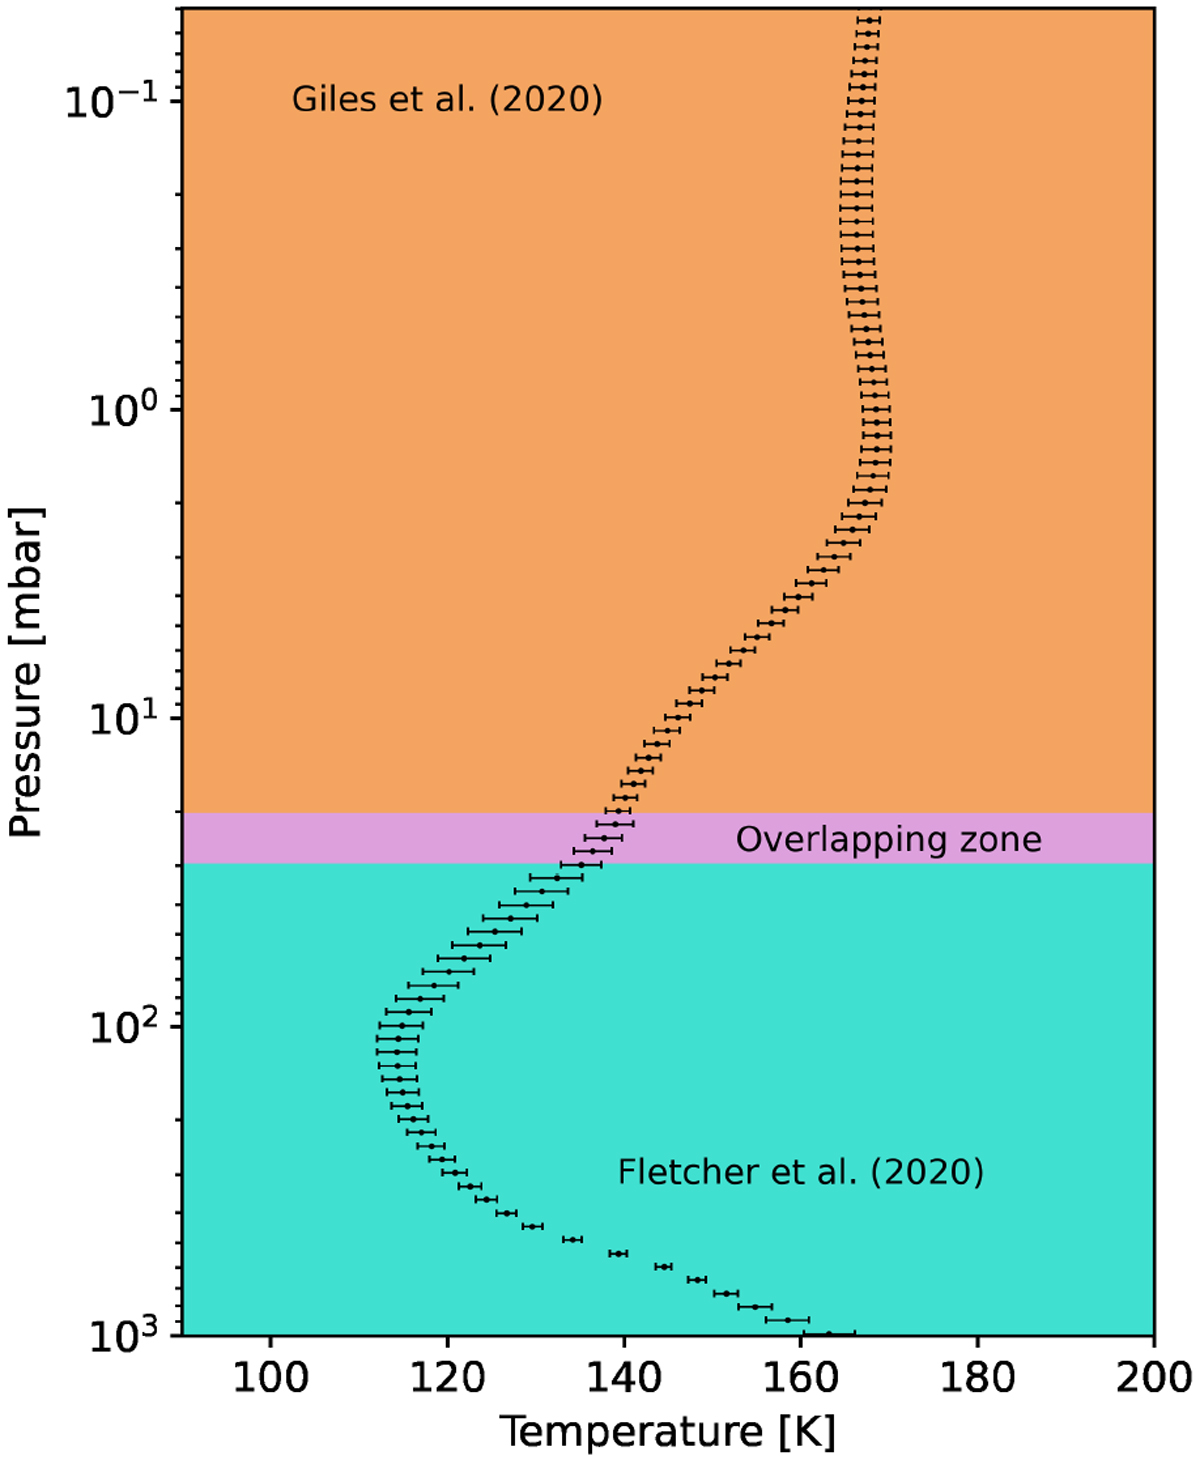
Vertical profile of the temperature at the equator extracted from the field of Fig. 7 from the combination of retrievals obtained from the high-spectral-resolution observations of Giles et al. (2020) (Fig. 3) and the retrievals from the lower spectral resolution observations of Fletcher et al. (2020), all performed between 12 and 20 March 2017. The two profiles are averaged in the 20–30 mbar pressure range (referred to as the overlapping zone on the plot).
Current usage metrics show cumulative count of Article Views (full-text article views including HTML views, PDF and ePub downloads, according to the available data) and Abstracts Views on Vision4Press platform.
Data correspond to usage on the plateform after 2015. The current usage metrics is available 48-96 hours after online publication and is updated daily on week days.
Initial download of the metrics may take a while.