Fig. 6.
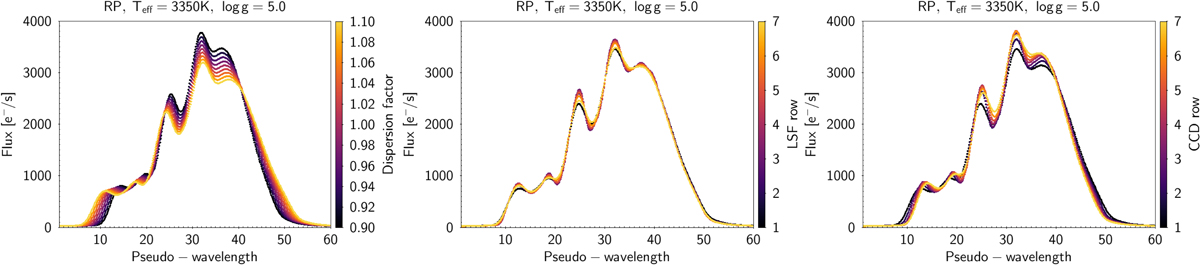
RP simulations, using the synthetic spectral energy distribution library of Lejeune et al. (1997), of the effect of ±10% dispersion variation (left), LSF conditions in the seven CCDs (centre), and both effects together as expected in each CCD (right), for a star with an effective temperature of Teff = 3350 K. The ±10% dispersion variation considered in the left plot represents the maximum variation expected for the different observations. The dispersion at a given time of the mission changes across the focal plane with the CCD. The latter effect is included in the plot at the right.
Current usage metrics show cumulative count of Article Views (full-text article views including HTML views, PDF and ePub downloads, according to the available data) and Abstracts Views on Vision4Press platform.
Data correspond to usage on the plateform after 2015. The current usage metrics is available 48-96 hours after online publication and is updated daily on week days.
Initial download of the metrics may take a while.