Fig. 5.
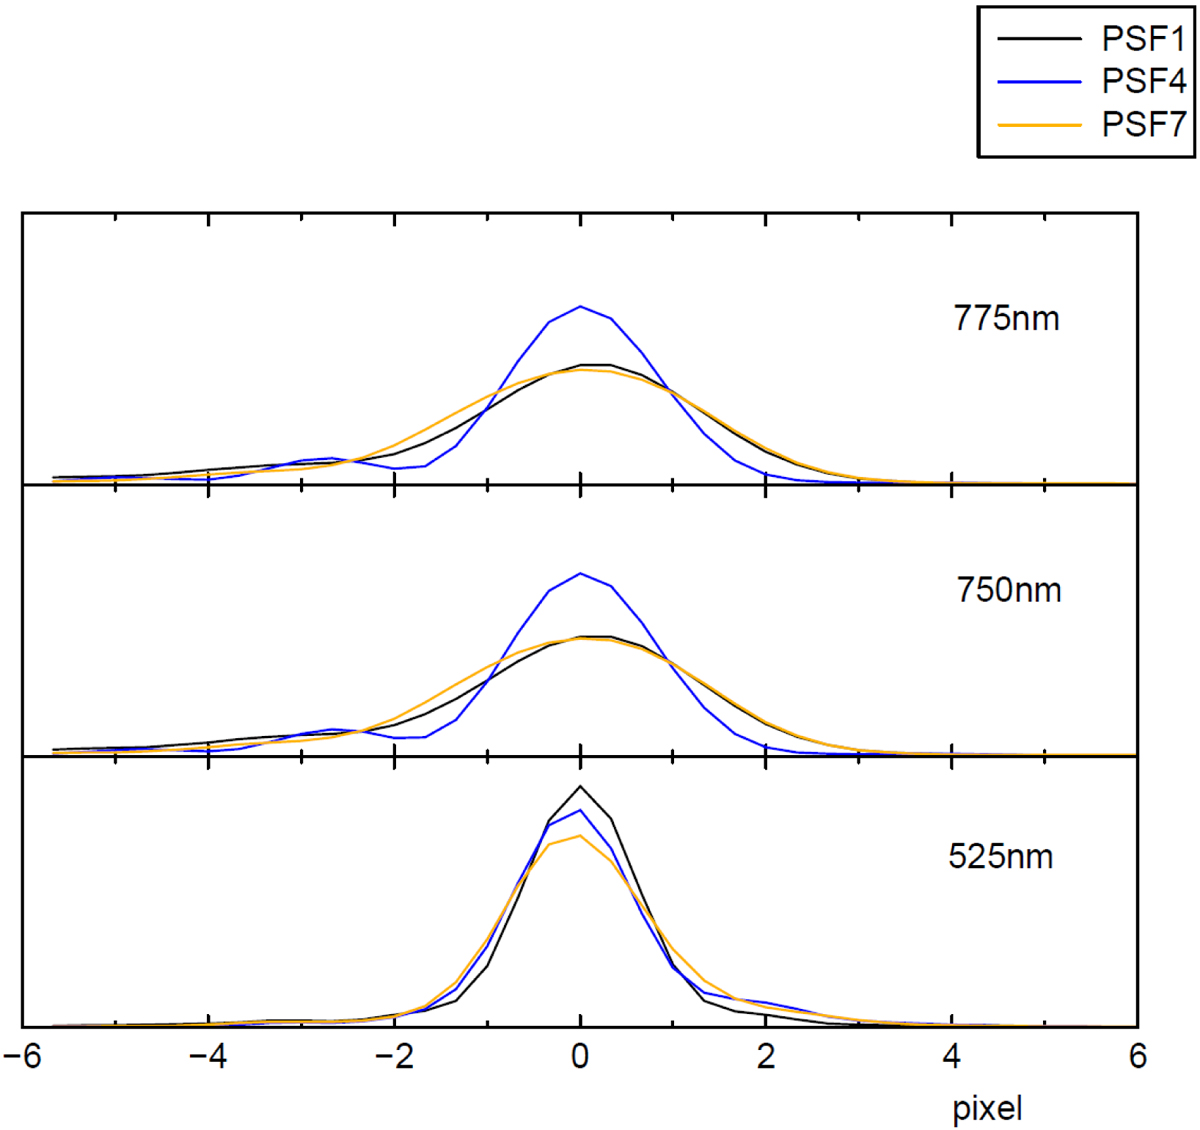
LSF at three different wavelengths (525 nm at MgH band in the bottom panel, 750 nm at pseudo-continuum region in the central panel, and 775 nm at TiO band in the top panel). In each panel, three different CCDs are plotted, corresponding to the bottom (CCD1 in black), middle (CCD4 in blue), and upper (CCD7 in orange) positions of the focal plane, respectively.
Current usage metrics show cumulative count of Article Views (full-text article views including HTML views, PDF and ePub downloads, according to the available data) and Abstracts Views on Vision4Press platform.
Data correspond to usage on the plateform after 2015. The current usage metrics is available 48-96 hours after online publication and is updated daily on week days.
Initial download of the metrics may take a while.