Fig. 20.
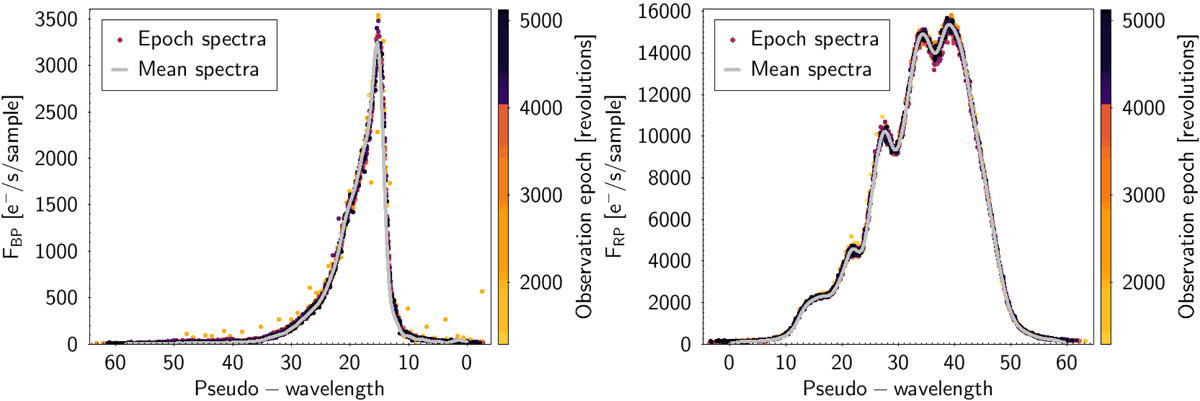
Calibrated epoch (dots) and mean spectra (grey line) for the source with GBP − GRP = 3.5 mag also plotted in Fig. 19. The different epochs in Gaia are measured in a number of six-hour revolutions done by the satellite while surveying the sky. An approximate correspondence between pseudo-wavelength values and absolute wavelengths can be found in Fig. 4.
Current usage metrics show cumulative count of Article Views (full-text article views including HTML views, PDF and ePub downloads, according to the available data) and Abstracts Views on Vision4Press platform.
Data correspond to usage on the plateform after 2015. The current usage metrics is available 48-96 hours after online publication and is updated daily on week days.
Initial download of the metrics may take a while.