Fig. 15.
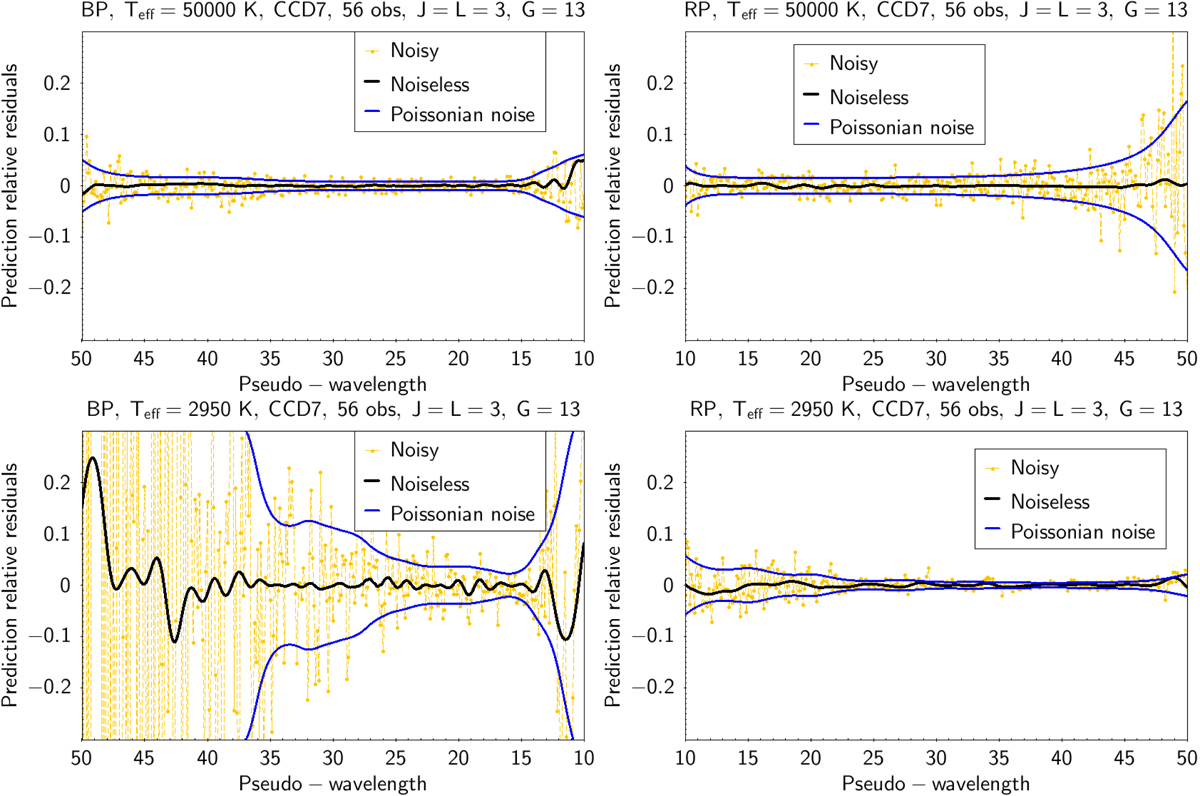
Relative residuals per sample obtained for the predicted epoch observation in CCD7 for a hot (top) and a cold (bottom) G = 13 mag simulated star using BaSeL-3.1 spectral energy distribution library (Lejeune et al. 1997) for BP (left) and RP (right). J and L values refer to parameters in Eq. (14). Pseudo-wavelength values smaller than 15 fall outside the nominal range of the BP instrument (having λ > 680 nm). An approximate correspondence between pseudo-wavelength values and absolute wavelengths can be found in Fig. 4.
Current usage metrics show cumulative count of Article Views (full-text article views including HTML views, PDF and ePub downloads, according to the available data) and Abstracts Views on Vision4Press platform.
Data correspond to usage on the plateform after 2015. The current usage metrics is available 48-96 hours after online publication and is updated daily on week days.
Initial download of the metrics may take a while.