Fig. 13.
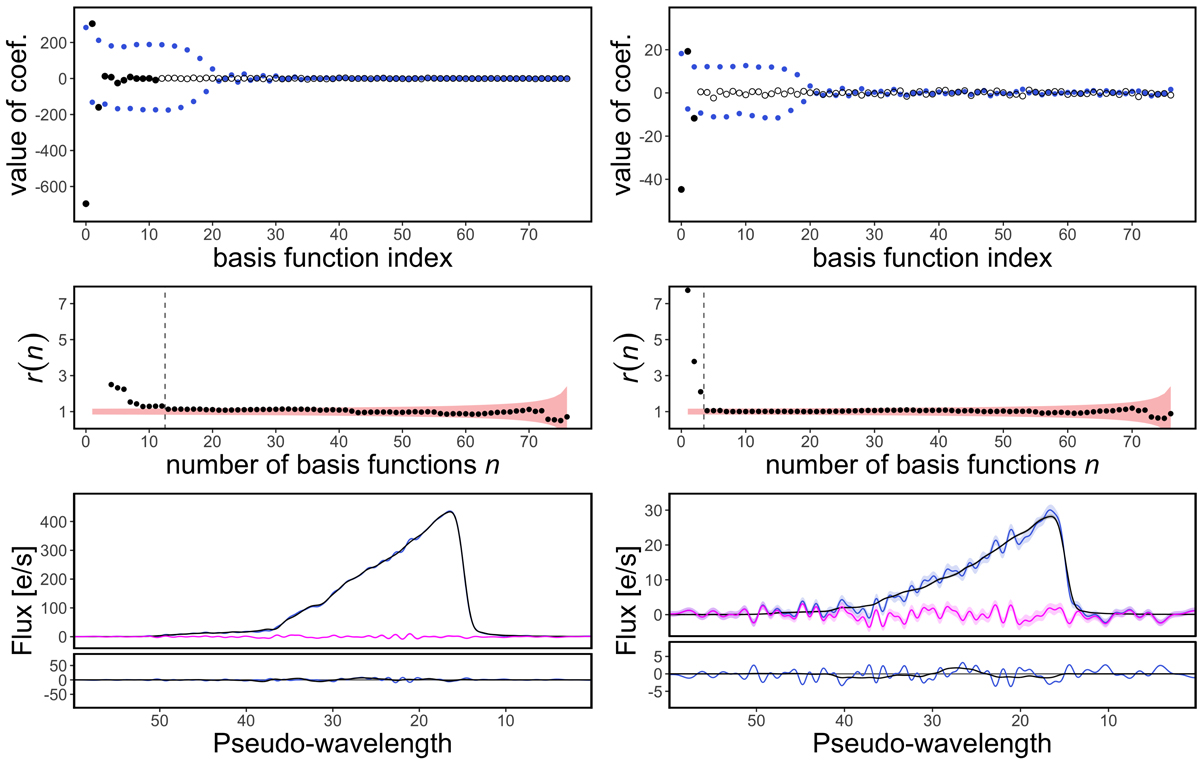
Top panel: coefficients that describe a BP spectrum for a simulated Sun-like star, with G = 16 mag (left) and G = 19 mag (right). Blue symbols are the coefficients in Hermite basis functions, black symbols represents those in rotated basis functions. Open symbols represent the coefficients dropped after truncation. Middle panel: normalised standard deviation of the coefficients, r(n), when excluding basis functions in ascending order. The red shaded region indicates twice the standard error on the standard deviation. r(n) values smaller than this threshold could be ignored producing similar mean spectra. Bottom panel: spectra as a function of pseudo-wavelength, for all coefficients (blue line), and for the truncated representation in the rotated Hermite basis functions (black line). The magenta line shows the contribution lost due to truncation. At the bottom of the panel, the differences with respect to the correct representation of the spectra are shown. Shaded regions indicate the 1-σ confidence regions. An approximate correspondence between pseudo-wavelength values and absolute wavelengths can be found in Fig. 4.
Current usage metrics show cumulative count of Article Views (full-text article views including HTML views, PDF and ePub downloads, according to the available data) and Abstracts Views on Vision4Press platform.
Data correspond to usage on the plateform after 2015. The current usage metrics is available 48-96 hours after online publication and is updated daily on week days.
Initial download of the metrics may take a while.