Free Access
Fig. 11.
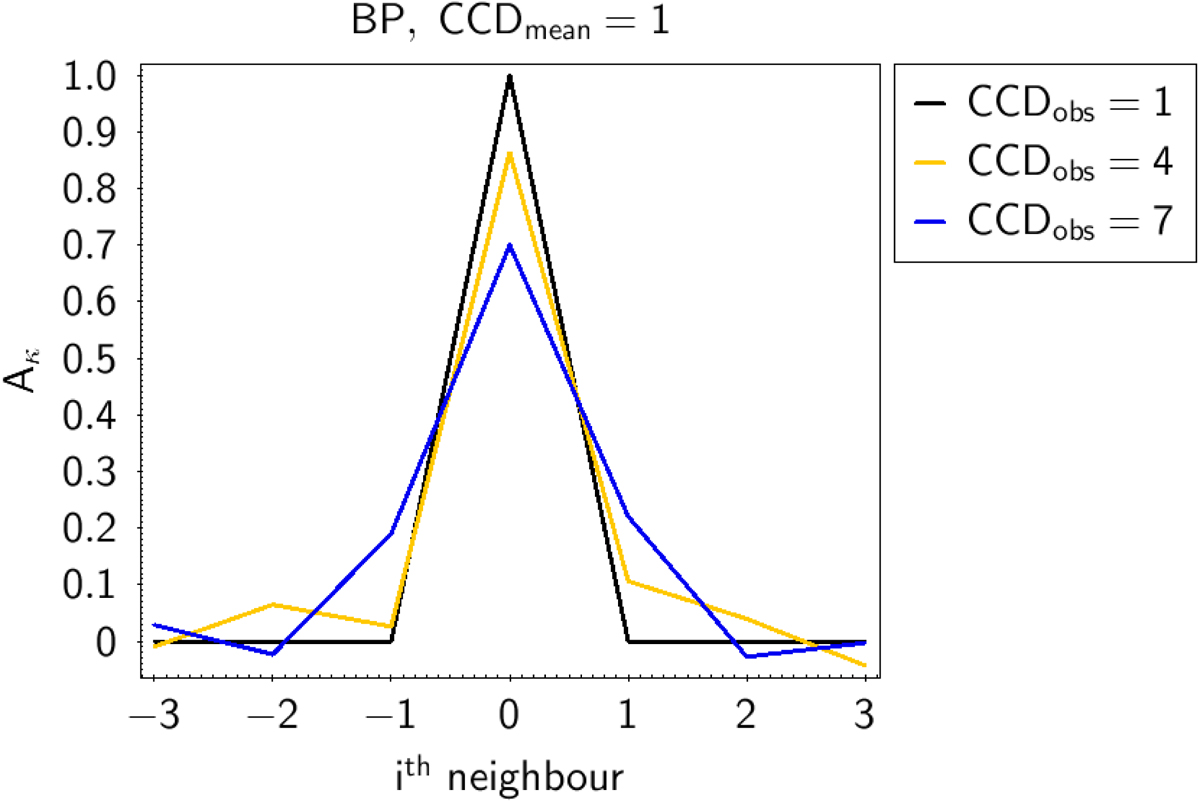
Change in the value of the coefficients when different Gaia BP CCDs (with different dispersion and LSF conditions) are considered for the observations with respect to the mean spectra. The cases of the mean spectra in the CCD1 reference system and observations in CCDs 1 (black), 4 (orange), and 7 (blue) are plotted here.
Current usage metrics show cumulative count of Article Views (full-text article views including HTML views, PDF and ePub downloads, according to the available data) and Abstracts Views on Vision4Press platform.
Data correspond to usage on the plateform after 2015. The current usage metrics is available 48-96 hours after online publication and is updated daily on week days.
Initial download of the metrics may take a while.