Fig. A.1.
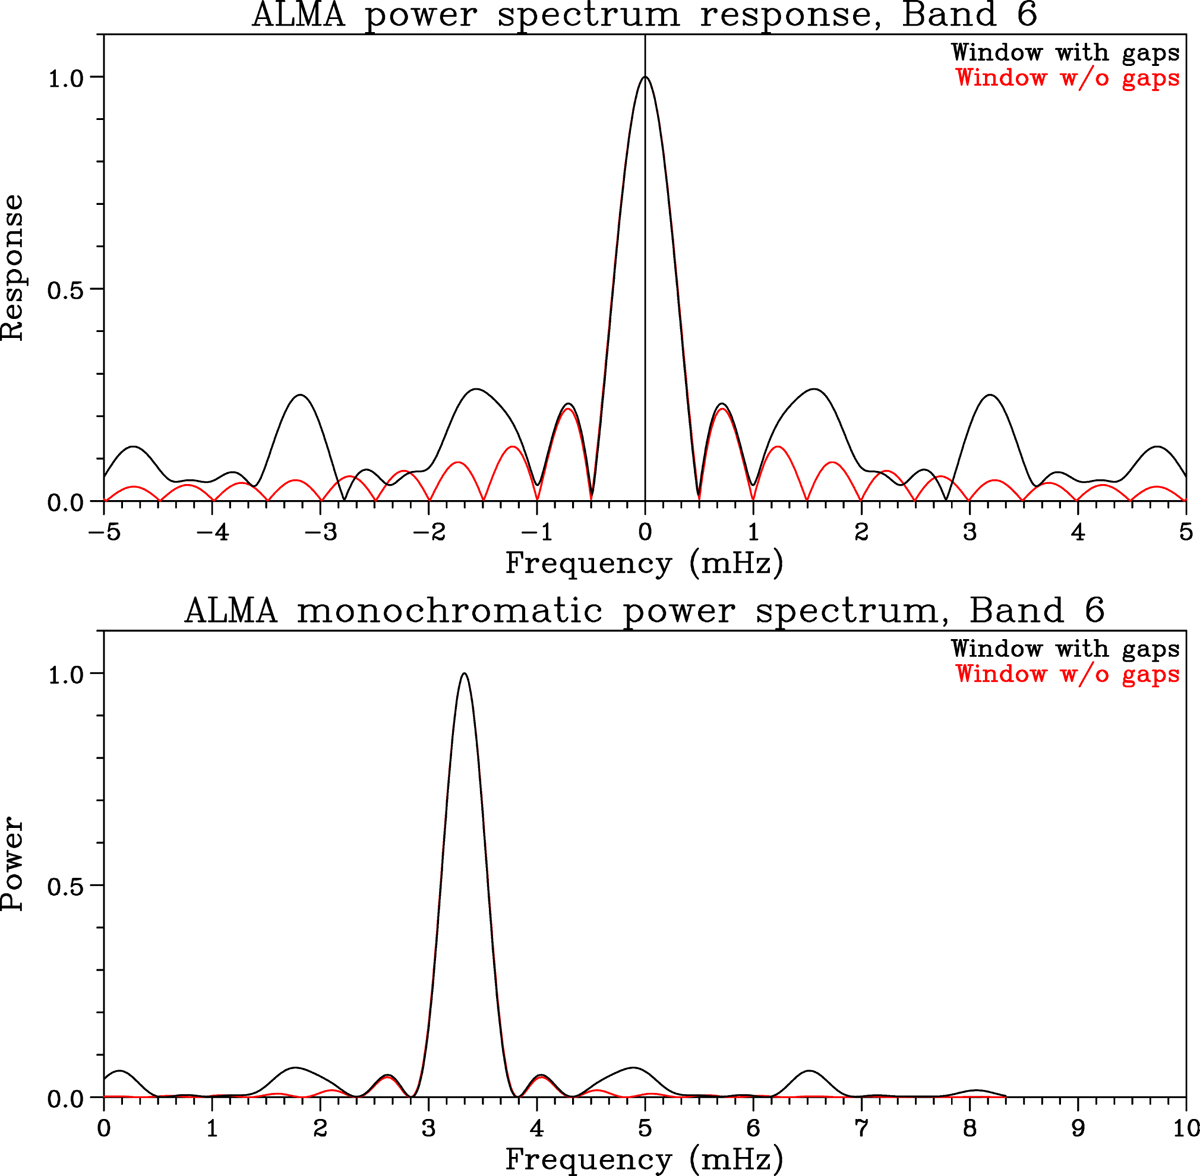
Effect of gaps. Top panel: modulus of the summation term in (A.6) for our Band 6 observations. The power spectrum of a monochromatic oscillation at 3.333 mHz is plotted in the bottom panel. The red curve is for a 30 min observation without gaps, the black curve is for an observation with the gaps of our Band 6 data set. All plots are normalized to a peak value of unity.
Current usage metrics show cumulative count of Article Views (full-text article views including HTML views, PDF and ePub downloads, according to the available data) and Abstracts Views on Vision4Press platform.
Data correspond to usage on the plateform after 2015. The current usage metrics is available 48-96 hours after online publication and is updated daily on week days.
Initial download of the metrics may take a while.