Fig. 6.
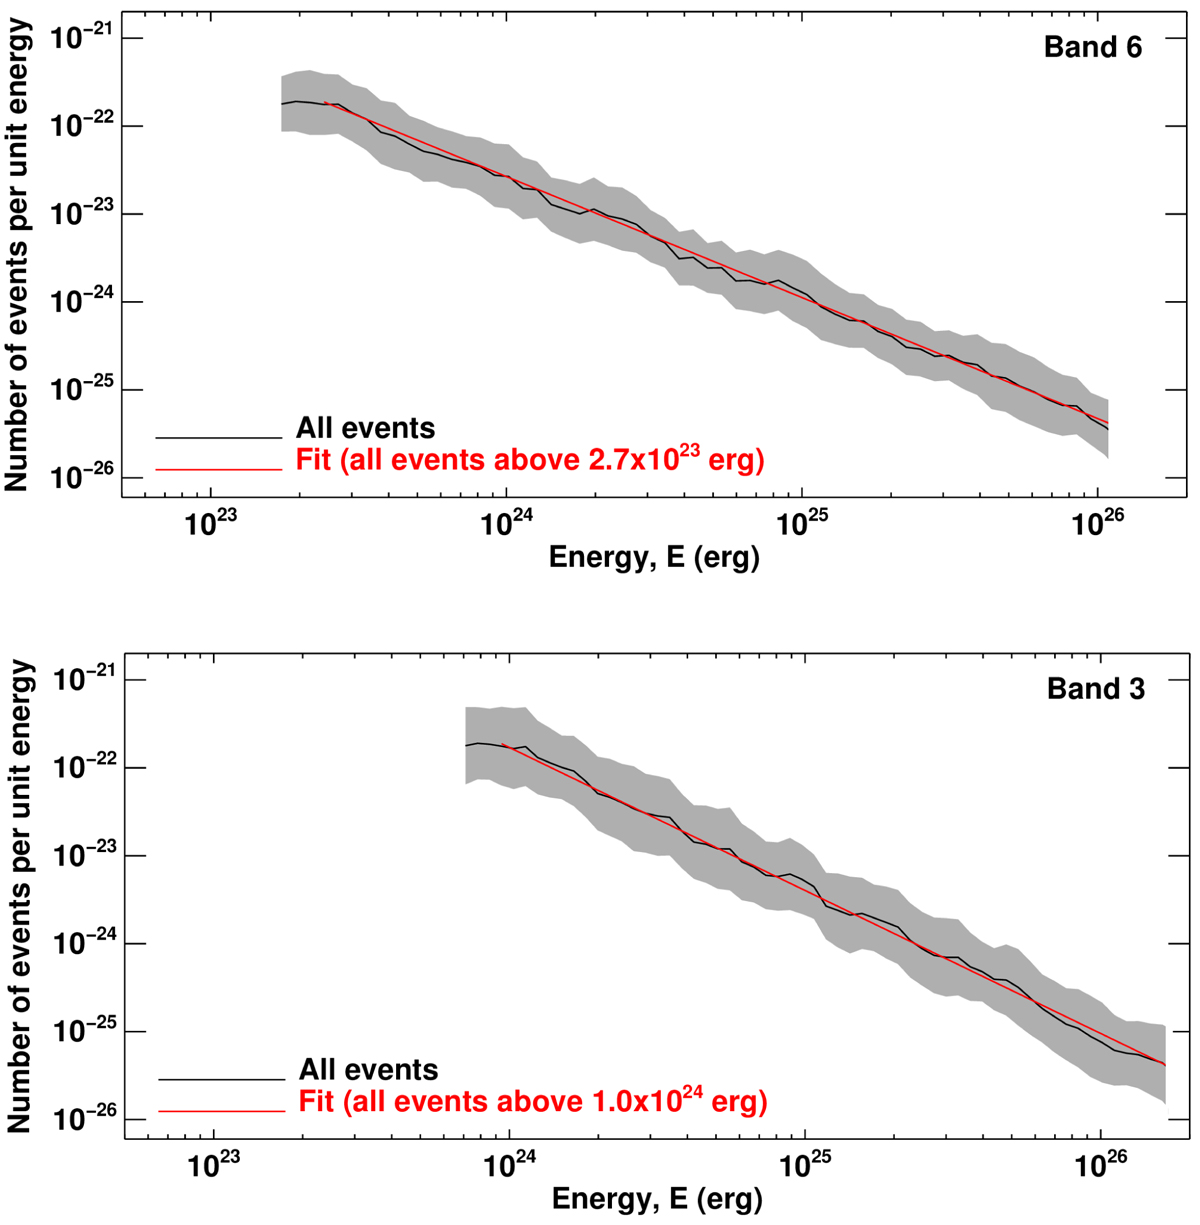
Energetics of transient brightenings. Top panel: black curve shows the frequency distribution of the energy of the transient brightenings detected at 1.26 mm. The gray band denotes the uncertainties (see text for details). The red line shows the power-law fit, with index of 1.64, of the frequency distribution for energies higher than 2.7 × 10²³ erg. Bottom panel: same as top panel for the events detected at 3 mm. The red line shows the power-law fit, with index of 1.73, of the frequency distribution for energies higher than 1024 erg.
Current usage metrics show cumulative count of Article Views (full-text article views including HTML views, PDF and ePub downloads, according to the available data) and Abstracts Views on Vision4Press platform.
Data correspond to usage on the plateform after 2015. The current usage metrics is available 48-96 hours after online publication and is updated daily on week days.
Initial download of the metrics may take a while.