Fig. 5.
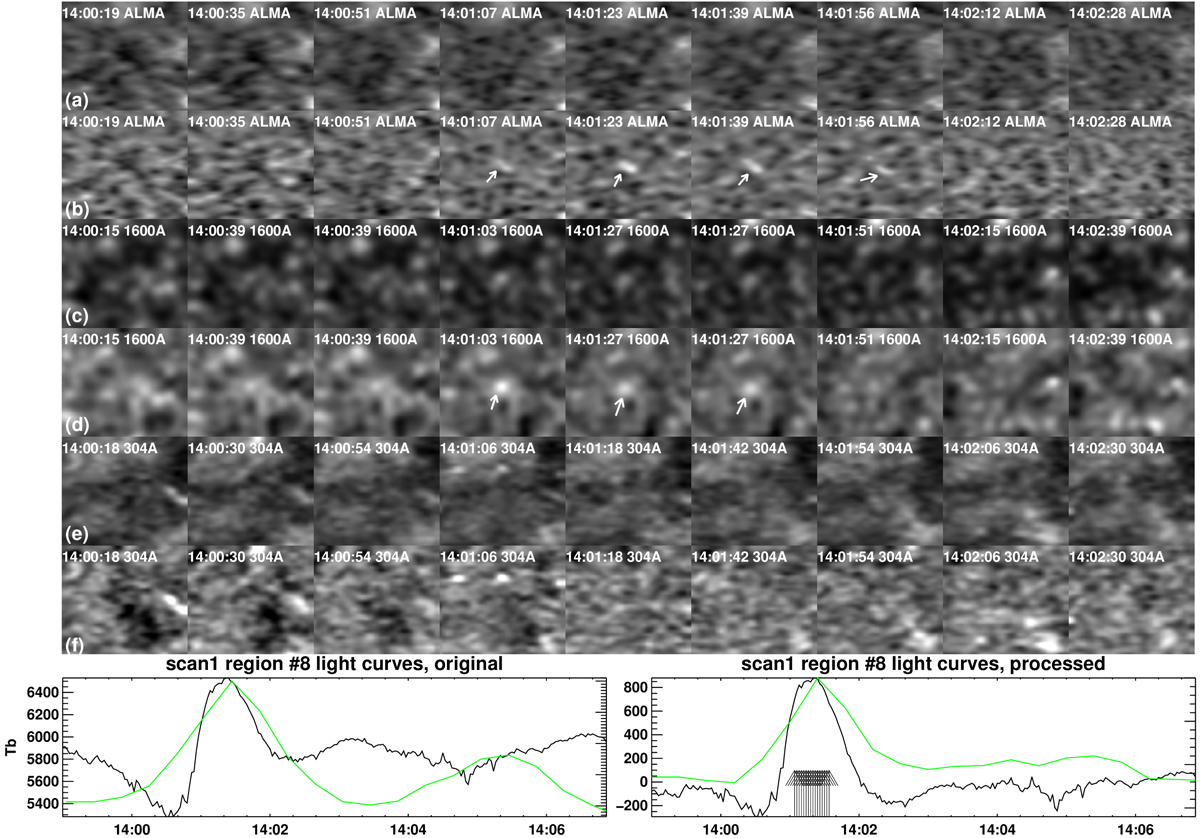
Transient brightening detected both at 1.26 mm and 1600 Å scan 1 data. In rows (a) and (b), we show representative 1.26 mm images before and after the subtraction of the average 1.26 mm image. Rows (c), (d) and (e), (f) have the same format as rows (a) and (b) but they show the corresponding 1600 Å data and 304 Å data, respectively. The white arrows point to the transient brightening in the 1.26 mm and 1600 Å data. The field of view of all images is 20″ × 20″. In the bottom row, we present the event time profiles at 1.26 mm (black curves) and 1600 Å (green curves) before and after our processing (left and right panels, respectively). The black arrows show the times in which the 1.26 mm emission is greater than the 2.5σ threshold above average. The 1600 Å time profiles have been normalized to match the vertical range of the 1.26 mm plots.
Current usage metrics show cumulative count of Article Views (full-text article views including HTML views, PDF and ePub downloads, according to the available data) and Abstracts Views on Vision4Press platform.
Data correspond to usage on the plateform after 2015. The current usage metrics is available 48-96 hours after online publication and is updated daily on week days.
Initial download of the metrics may take a while.