Fig. 4.
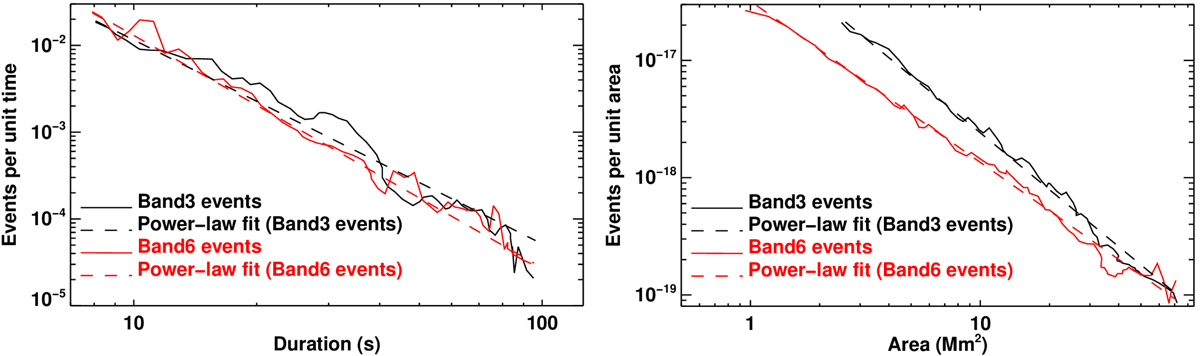
Statistics of the duration and area of the transient brightenings. Left panel: frequency distribution of the duration of the transient brightenings detected at 1.26 mm and 3 mm (red and black solid curves, respectively). The dashed red and dashed black lines show power-law fits of those distributions. Right panel: same as left panel, but for the frequency distribution of maximum area.
Current usage metrics show cumulative count of Article Views (full-text article views including HTML views, PDF and ePub downloads, according to the available data) and Abstracts Views on Vision4Press platform.
Data correspond to usage on the plateform after 2015. The current usage metrics is available 48-96 hours after online publication and is updated daily on week days.
Initial download of the metrics may take a while.