Fig. 3.
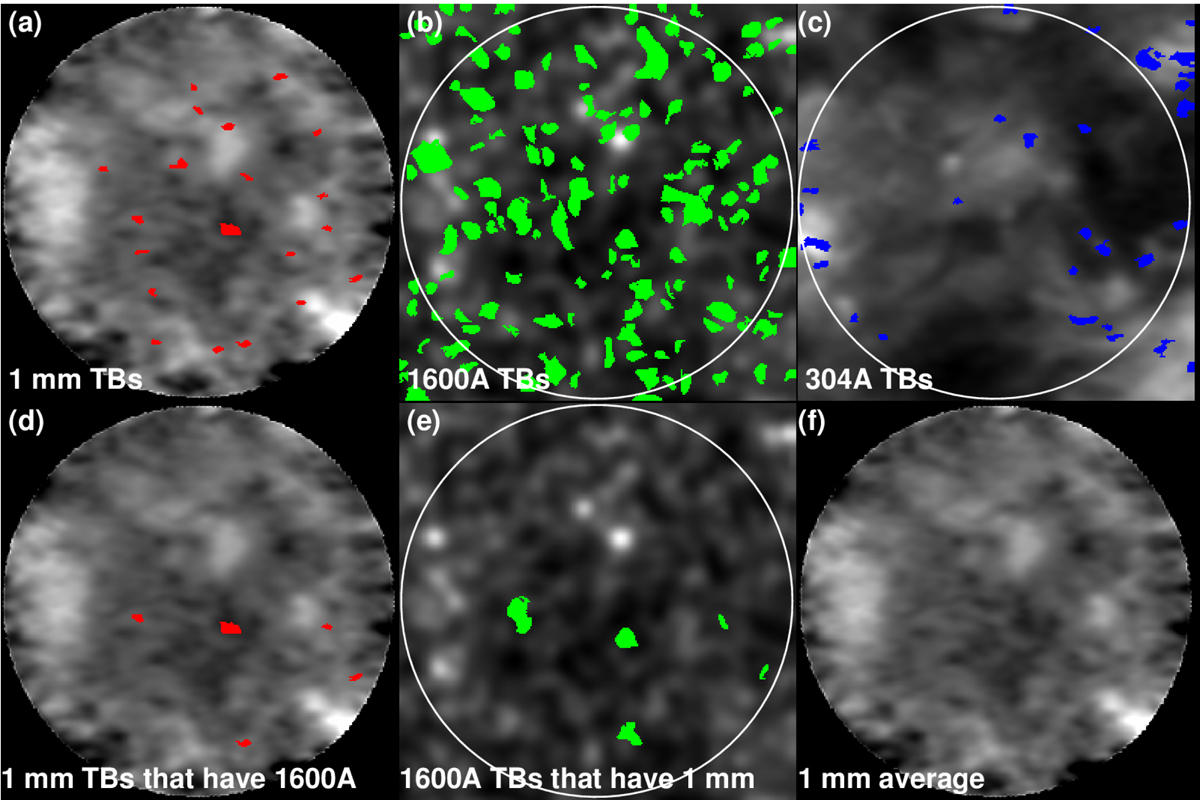
Display (overlayed on the pertinent average images) of the pixels that were associated with transient bightenings in ALMA 1.26 mm (red), AIA 1600 Å (green), and AIA 304 Å (blue) for scan 1 data. In the images of the top row, we mark all events at each wavelength. In panels d and e of the bottom row we mark only the paired events, that is, those that were detected both at 1.26 mm and 1600 Å, respectively. Panel f: average 1.26 mm image. The white circles denote the ALMA field of view.
Current usage metrics show cumulative count of Article Views (full-text article views including HTML views, PDF and ePub downloads, according to the available data) and Abstracts Views on Vision4Press platform.
Data correspond to usage on the plateform after 2015. The current usage metrics is available 48-96 hours after online publication and is updated daily on week days.
Initial download of the metrics may take a while.