Fig. 2.
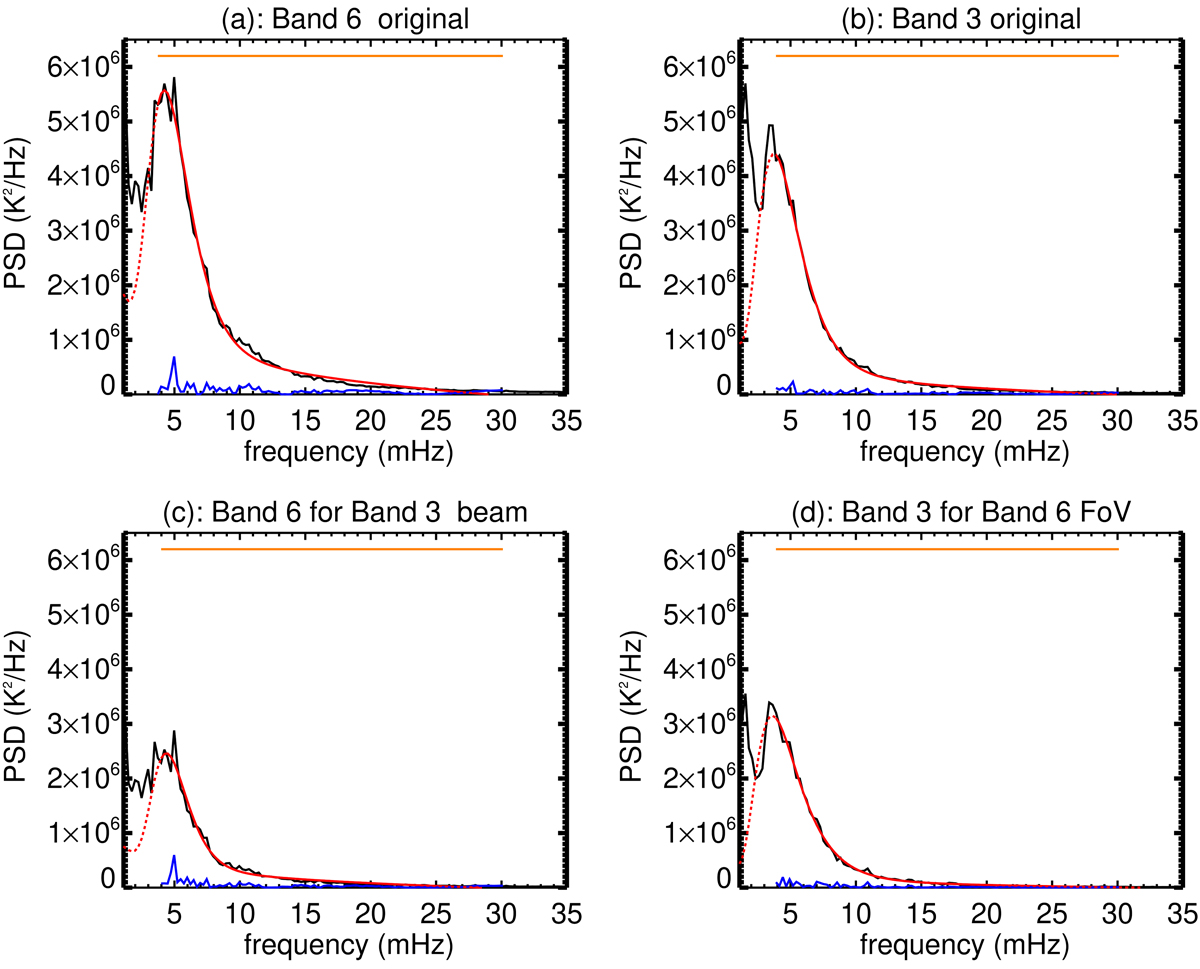
Spatially averaged PSDs for the series discussed in Sect. 3: Band 6 original data (panel a), Band 3 original data (panel b), Band 6 data degraded to the resolution of Band 3 (panel c), and Band 6 for Band 3 FoV (panel d). The spectra of panels c and d are appropriate for meaningful comparisons between Band 6 and Band 3. Black solid lines represent the observed PSDs. Horizontal orange line corresponds to the frequency range employed in the fits. Red solid curves show the fit of the observed PSDs and red dashed lines show how the best fit extends outside the frequency range used in the fit. Solid blue lines show the absolute value of the fit residuals.
Current usage metrics show cumulative count of Article Views (full-text article views including HTML views, PDF and ePub downloads, according to the available data) and Abstracts Views on Vision4Press platform.
Data correspond to usage on the plateform after 2015. The current usage metrics is available 48-96 hours after online publication and is updated daily on week days.
Initial download of the metrics may take a while.