Fig. 1.
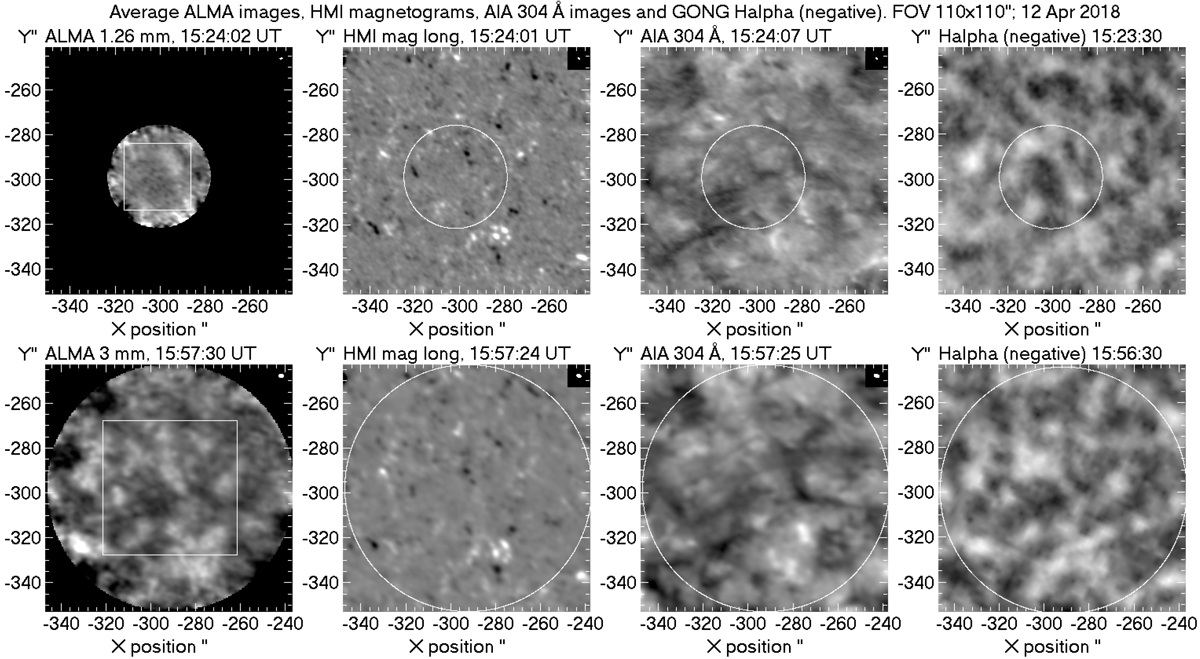
Average images during ALMA scan 8 in Band 6 (top-left) and during scan 1 in Band 3 (bottom-left), together with the corresponding HMI magnetograms (saturated at ±50 G), as well as AIA 304 Å and Hα negative images from GONG. The insert at the top right corner of the images shows the ALMA resolution. The squares in the ALMA images show the regions analyzed for oscillations, the circles in the other images mark the ALMA field of view. All images are oriented with the celestial north pointing up.
Current usage metrics show cumulative count of Article Views (full-text article views including HTML views, PDF and ePub downloads, according to the available data) and Abstracts Views on Vision4Press platform.
Data correspond to usage on the plateform after 2015. The current usage metrics is available 48-96 hours after online publication and is updated daily on week days.
Initial download of the metrics may take a while.