Fig. 6.
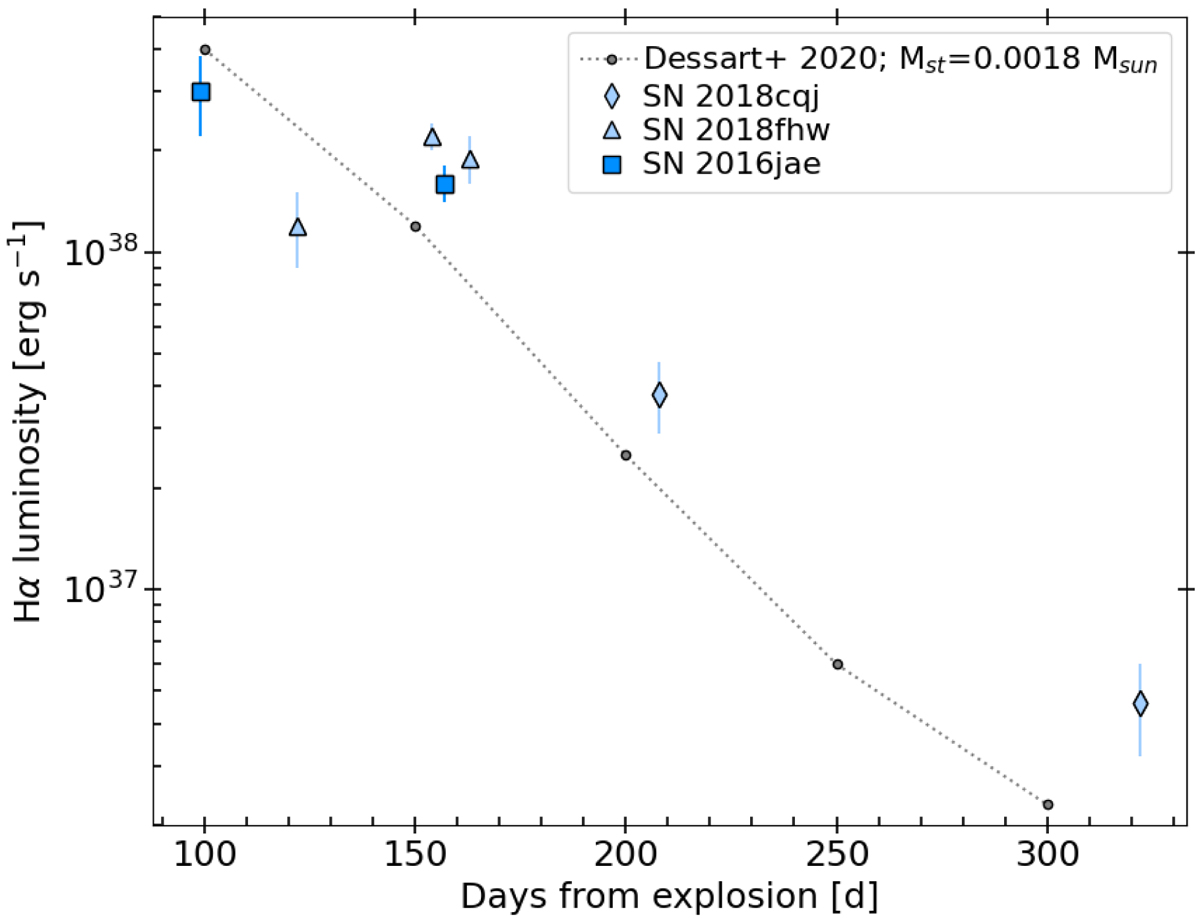
Evolution of the luminosity of Hα of SNe 2016jae, 2018cqj, and 2018fhw. For comparison, we have also plotted an average value for the subset of models with Mst = 0.0018M⊙ of Dessart et al. (2020) (dotted line). For the SNe of the sample, we have assumed 15 days of rise time (average from the values found by Hsiao et al. 2015 and Vallely et al. 2019).
Current usage metrics show cumulative count of Article Views (full-text article views including HTML views, PDF and ePub downloads, according to the available data) and Abstracts Views on Vision4Press platform.
Data correspond to usage on the plateform after 2015. The current usage metrics is available 48-96 hours after online publication and is updated daily on week days.
Initial download of the metrics may take a while.