Fig. 5.
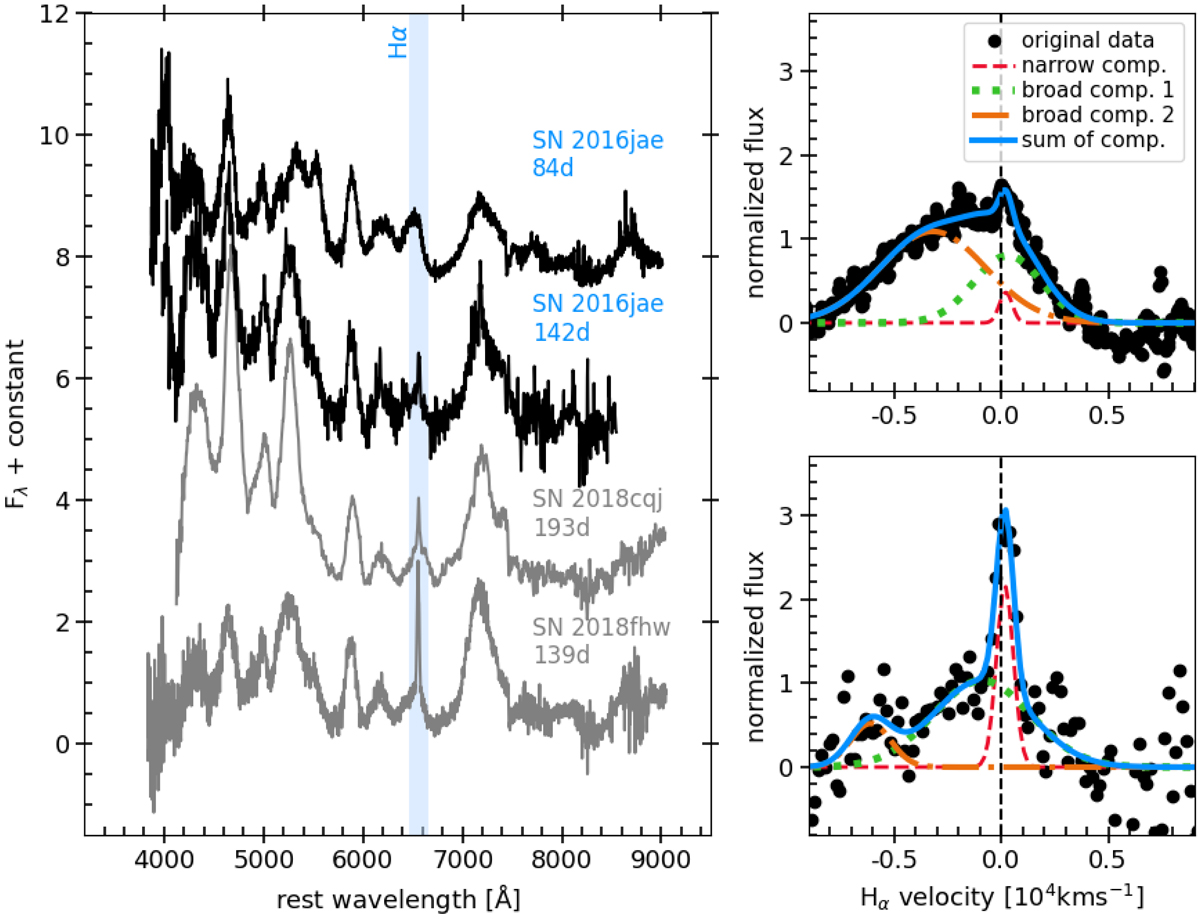
Hα emission lines in the late-time optical spectra of SN 2016jae. Left: comparison of SN 2016jae late-time optical spectra, along with those of the SNe 2018cqj and 2018fhw at similar epochs. All spectra were redshift and reddening corrected (values adopted from the literature; see also Table B.1). Ages are relative to B maximum light. The locations of the Hα emission line are also indicated. Right: decomposition of the Hα emission line of SN 2016jae at phases 84.0 (top) and 141.8 d (bottom). Three Gaussian profiles have been used, for the narrow Hα and the two broad components of iron-group elements.
Current usage metrics show cumulative count of Article Views (full-text article views including HTML views, PDF and ePub downloads, according to the available data) and Abstracts Views on Vision4Press platform.
Data correspond to usage on the plateform after 2015. The current usage metrics is available 48-96 hours after online publication and is updated daily on week days.
Initial download of the metrics may take a while.