Free Access
Fig. 4.
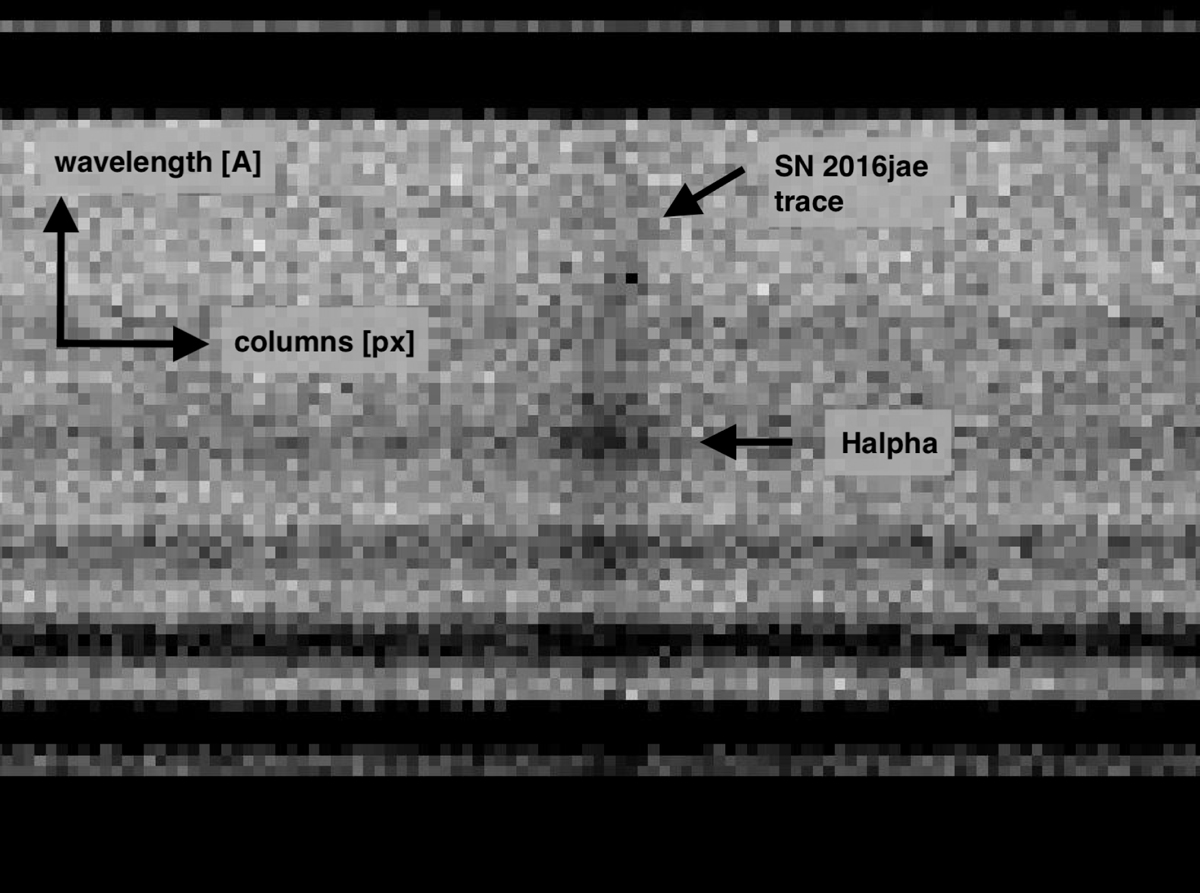
Hα emission line in the two-dimensional spectrum of SN 2016jae taken with GTC/OSIRIS on 2017 May 18 (phase 141.8 d from the assumed B maximum date). The wavelength is up, and the spatial direction is to the right.
Current usage metrics show cumulative count of Article Views (full-text article views including HTML views, PDF and ePub downloads, according to the available data) and Abstracts Views on Vision4Press platform.
Data correspond to usage on the plateform after 2015. The current usage metrics is available 48-96 hours after online publication and is updated daily on week days.
Initial download of the metrics may take a while.