Fig. 2.
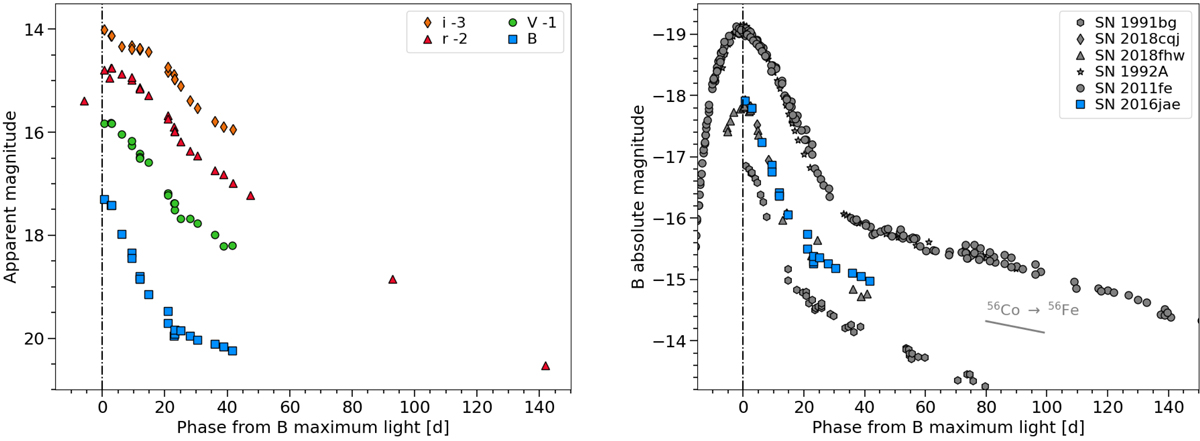
Optical broadband light curves of SN 2016jae. Left: BVri light curves of SN 2016jae. The light curves have been shifted for clarity by the amounts indicated in the legend. Right: absolute B light curve of SN 2016jae, shown along with those of SNe 1991bg, 2018cqj, 2018fhw, 1992A, and 2011fe. For both panels, the dot-dashed vertical line indicates the B-band maximum light. The uncertainties for most data points are smaller than the plotted symbols.
Current usage metrics show cumulative count of Article Views (full-text article views including HTML views, PDF and ePub downloads, according to the available data) and Abstracts Views on Vision4Press platform.
Data correspond to usage on the plateform after 2015. The current usage metrics is available 48-96 hours after online publication and is updated daily on week days.
Initial download of the metrics may take a while.