Fig. A.4.
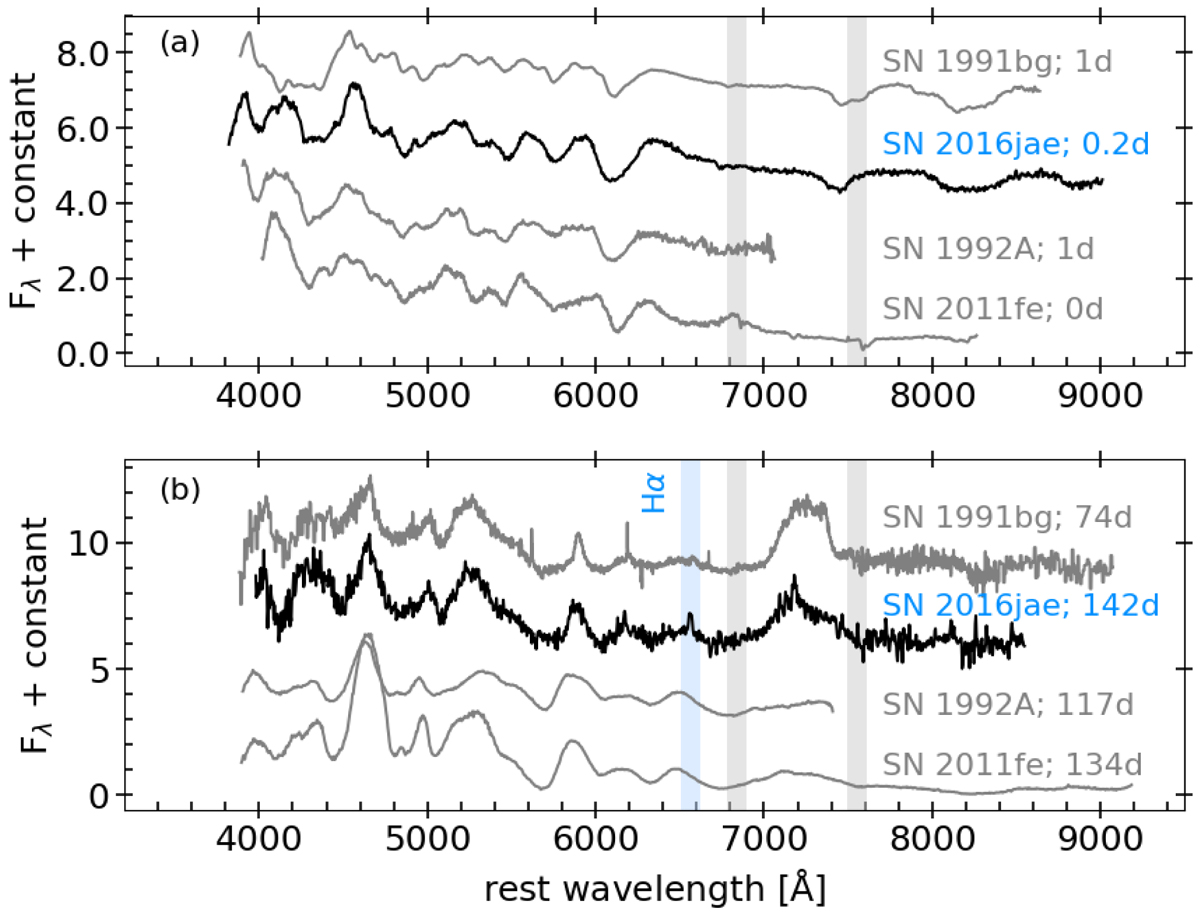
Early- (a) and late- (b) time comparison of SN 2016jae optical spectra, along with those of the sub-luminous SN 1991bg and the normal Ia SNe 1992A and 2011fe at similar epochs. All spectra have been corrected by redshift and extinction (adopted values and references are reported in Table B.1). Ages are relative to B maximum light. The grey columns show the location of the strongest telluric band, which has been removed when possible.
Current usage metrics show cumulative count of Article Views (full-text article views including HTML views, PDF and ePub downloads, according to the available data) and Abstracts Views on Vision4Press platform.
Data correspond to usage on the plateform after 2015. The current usage metrics is available 48-96 hours after online publication and is updated daily on week days.
Initial download of the metrics may take a while.