Fig. 2.
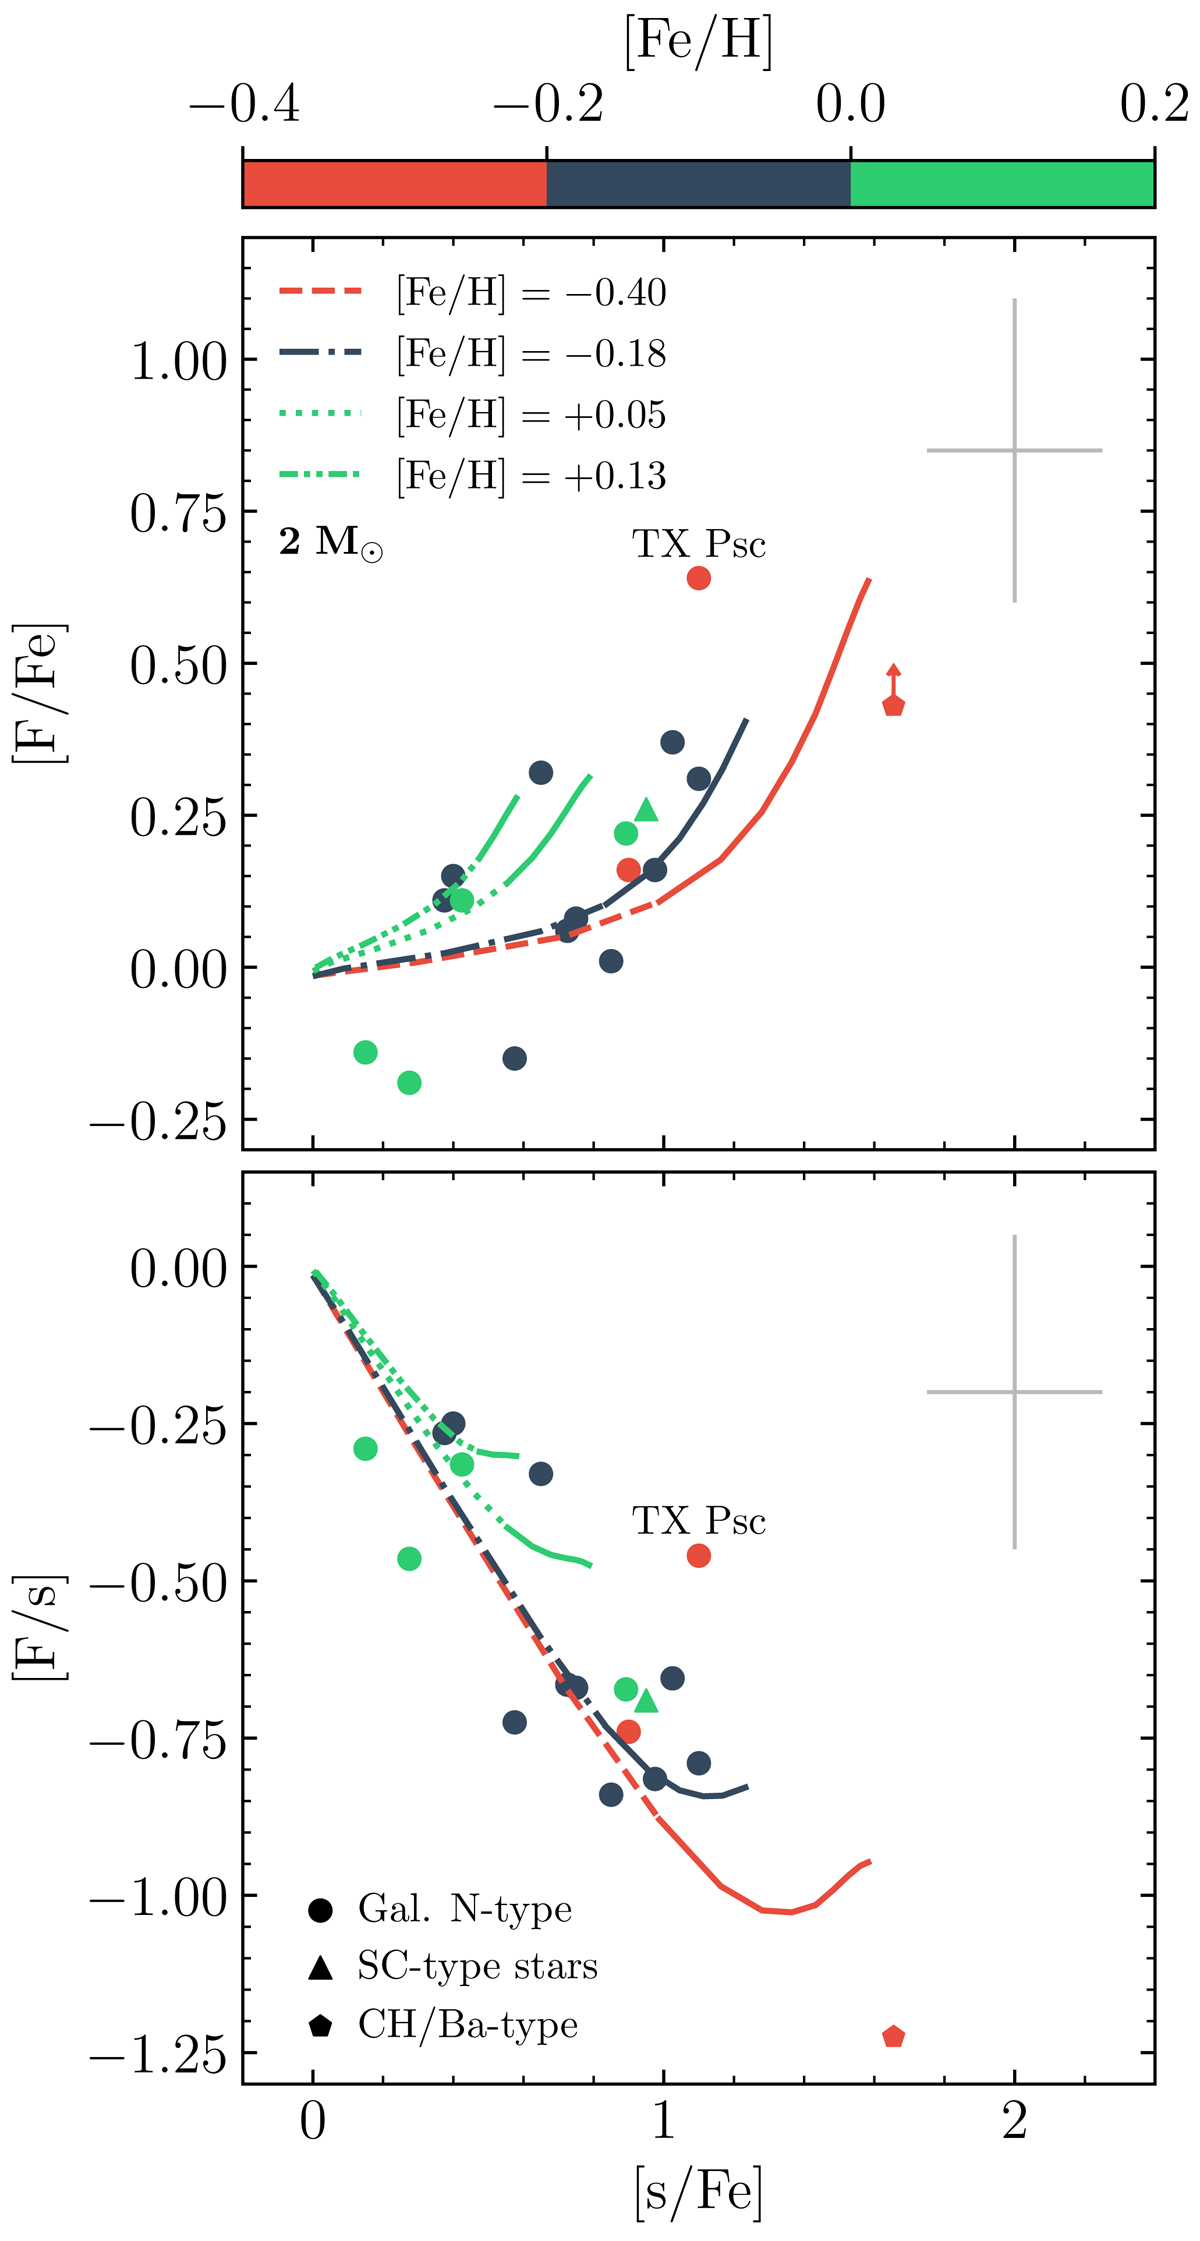
Observed [F/Fe] (top panel) and [F/s] (bottom panel) vs. average s-element enhancements compared with theoretical predictions for 2 M⊙ and close-to-solar metallicity models. Symbols are the same as in Fig. 1. Data points and theoretical lines are color-coded by [Fe/H]. The continuous portion of the lines represents the theoretical C-rich phase, and the discontinuous portion represents the O-rich phase. Typical uncertainties are shown. See text for details.
Current usage metrics show cumulative count of Article Views (full-text article views including HTML views, PDF and ePub downloads, according to the available data) and Abstracts Views on Vision4Press platform.
Data correspond to usage on the plateform after 2015. The current usage metrics is available 48-96 hours after online publication and is updated daily on week days.
Initial download of the metrics may take a while.