Fig. 5.
Download original image
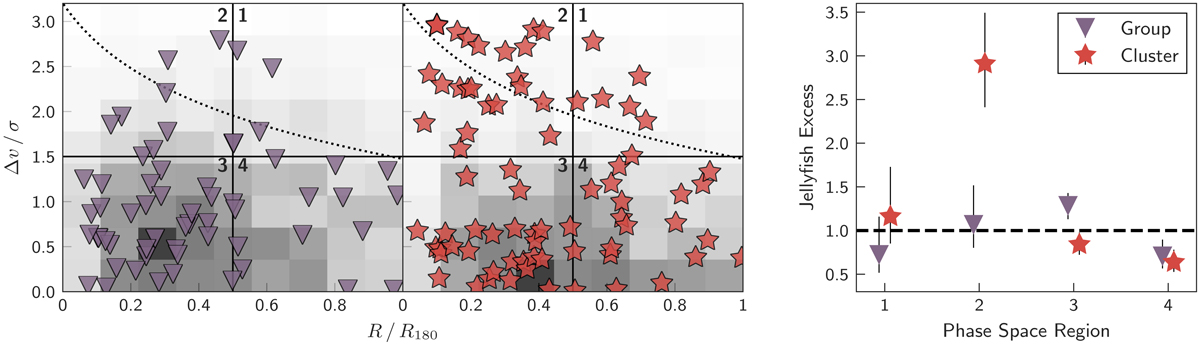
Group and cluster jellyfish galaxies in projected phase space. Left: velocity offset versus projected radius. Data markers correspond to jellyfish galaxies in groups (purple triangles) and clusters (red stars), and the background 2D histograms show the distribution for SDSS group galaxies and SDSS cluster galaxies in their respective panels. For reference, we also show the escape velocity caustic for an NFW density profile with the dotted line (e.g., Navarro et al. 1997; Jaffé et al. 2015). Right: excess of jellyfish galaxies, relative to SDSS group/cluster galaxies, in each of the four phase space quadrants. Red stars correspond to jellyfish galaxies in clusters and purple triangles show jellyfish galaxies in groups. Error bars are 1σ statistical uncertainties following Cameron (2011).
Current usage metrics show cumulative count of Article Views (full-text article views including HTML views, PDF and ePub downloads, according to the available data) and Abstracts Views on Vision4Press platform.
Data correspond to usage on the plateform after 2015. The current usage metrics is available 48-96 hours after online publication and is updated daily on week days.
Initial download of the metrics may take a while.