Free Access
Fig. 11.
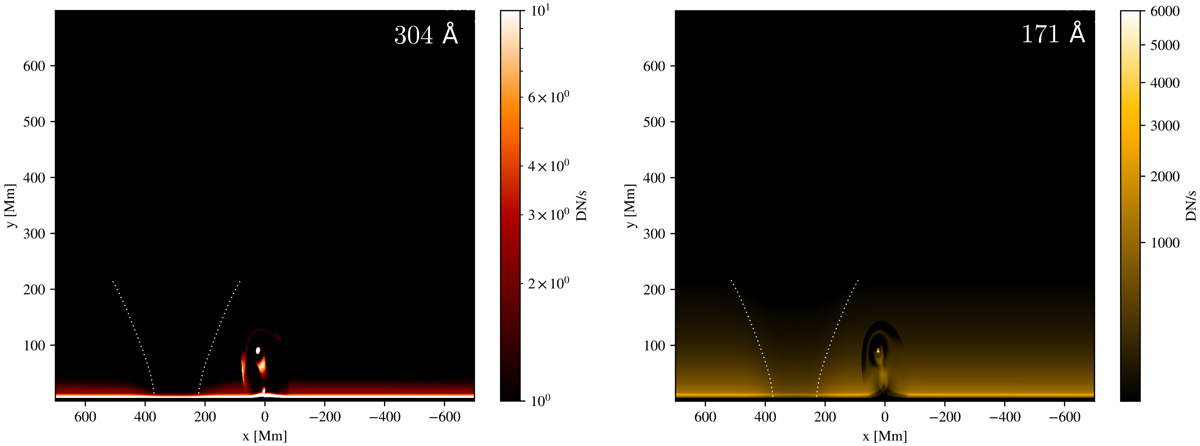
Synthetic EUV emission for filters 304 Å and 171 Å using the AIA response temperature. White dotted lines represent the estimated boundary of the CH. The animation of the full evolution is available online.
Current usage metrics show cumulative count of Article Views (full-text article views including HTML views, PDF and ePub downloads, according to the available data) and Abstracts Views on Vision4Press platform.
Data correspond to usage on the plateform after 2015. The current usage metrics is available 48-96 hours after online publication and is updated daily on week days.
Initial download of the metrics may take a while.