Fig. 5.
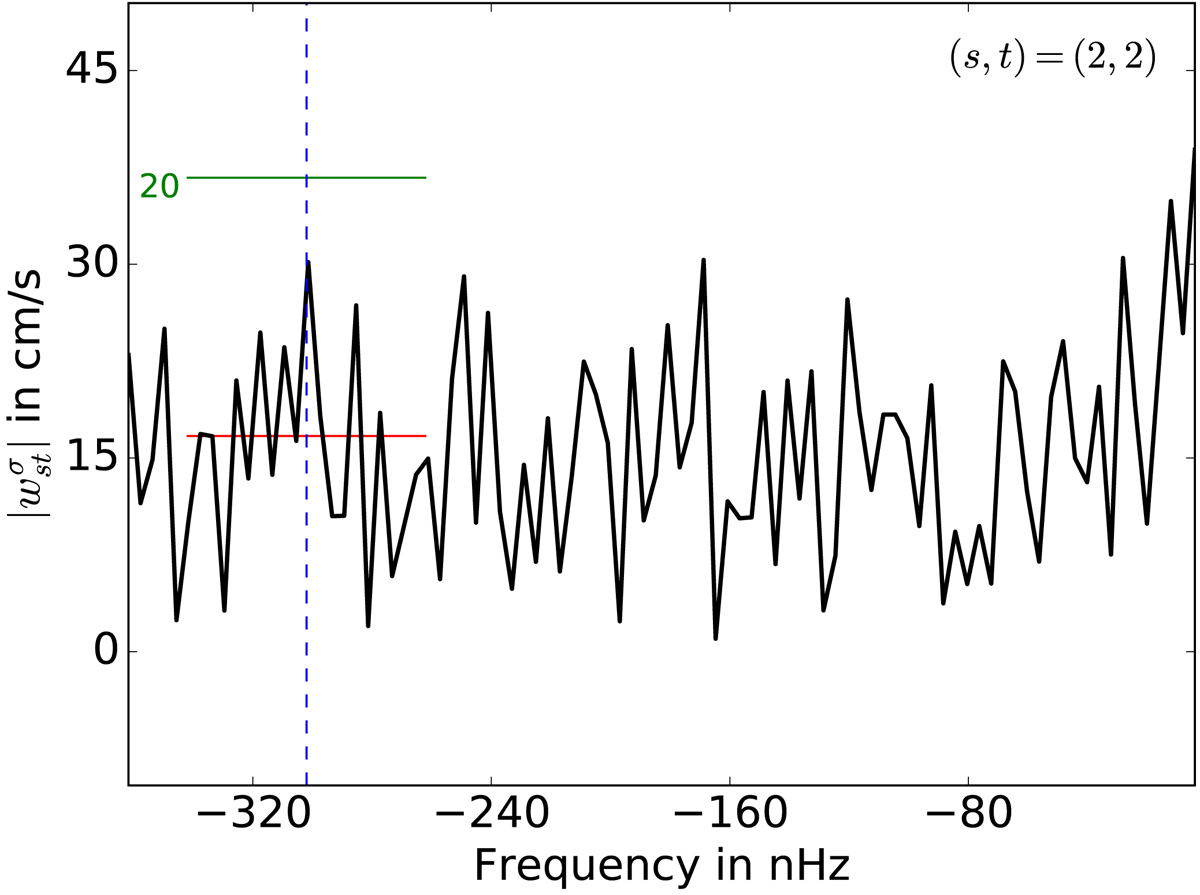
Power spectrum for Rossby mode (s, t) = (2, 2) from analyses of 8 years of SDO/HMI data. The blue-dashed vertical line indicates the theoretically anticipated frequency of the s = 2 sectoral mode. The solid red line indicates the background power over the frequency range [ − 342, −262] nHz. The green line corresponds to the power of the sectoral Rossby mode s = 2 with an amplitude of 20 cm s−1.
Current usage metrics show cumulative count of Article Views (full-text article views including HTML views, PDF and ePub downloads, according to the available data) and Abstracts Views on Vision4Press platform.
Data correspond to usage on the plateform after 2015. The current usage metrics is available 48-96 hours after online publication and is updated daily on week days.
Initial download of the metrics may take a while.