Fig. 4.
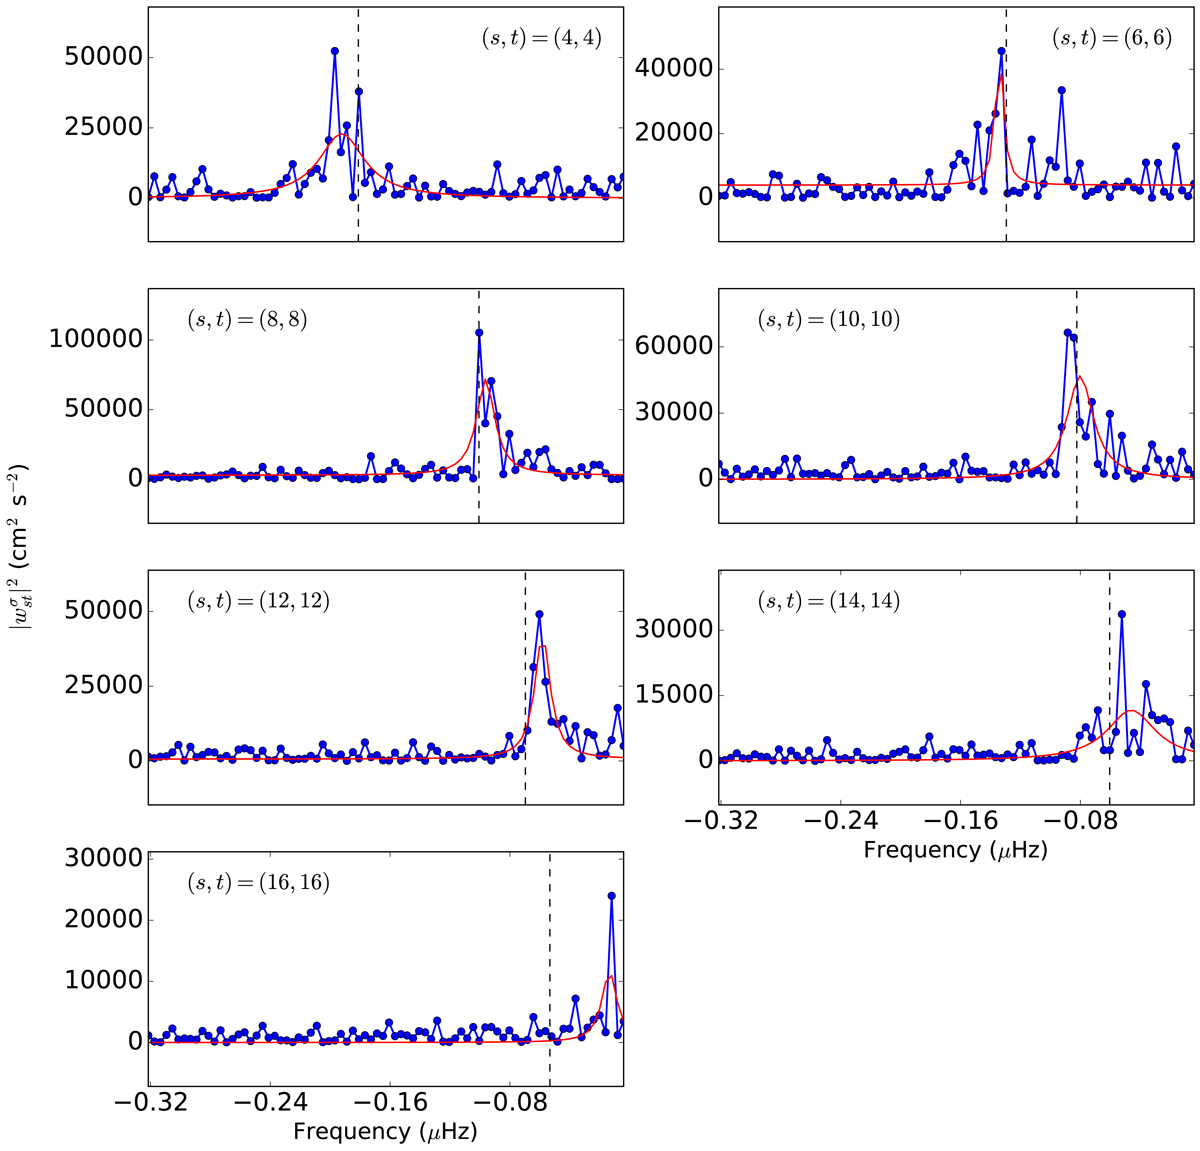
Analyses from 8 years of SDO/HMI data. Power spectra of even-degree sectoral Rossby modes (value mentioned in each panel) at a depth of 0.98 R⊙ are shown by solid blue lines with circles. The Lorentzian function with a constant background, as described in Sect. 3, has been fitted to these spectra to obtain the mode frequency, line-width, and amplitude. These fits are tabulated in Table 1. The fit spectrum is shown by the solid red line.
Current usage metrics show cumulative count of Article Views (full-text article views including HTML views, PDF and ePub downloads, according to the available data) and Abstracts Views on Vision4Press platform.
Data correspond to usage on the plateform after 2015. The current usage metrics is available 48-96 hours after online publication and is updated daily on week days.
Initial download of the metrics may take a while.