Fig. 2.
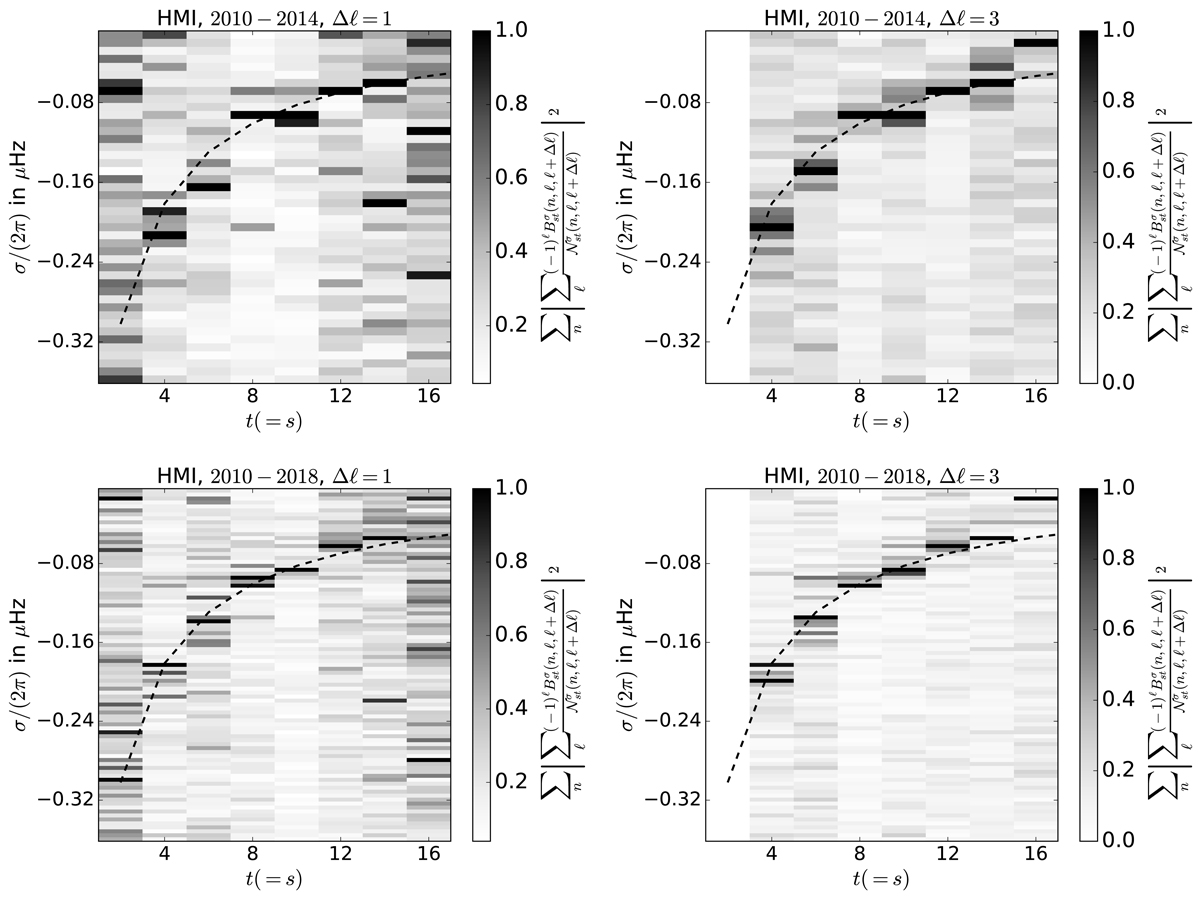
Estimated values of the weighted sum ![]() , using the observed B-coefficients obtained after considering the coupling between acoustic modes with Δℓ = 1 (left panel) and 3 (right) is plotted here. Upper and lower panels: results from analyses of 4 and 8 years of SDO/HMI data, respectively. The power for each azimuthal order, t, has been normalized. The black-dashed line is the theoretical dispersion relation for a uniformly rotating fluid with rotation frequency Ω/2π = 453 nHz. Modes with even azimuthal orders ranging from t = 2 to 16 are shown here.
, using the observed B-coefficients obtained after considering the coupling between acoustic modes with Δℓ = 1 (left panel) and 3 (right) is plotted here. Upper and lower panels: results from analyses of 4 and 8 years of SDO/HMI data, respectively. The power for each azimuthal order, t, has been normalized. The black-dashed line is the theoretical dispersion relation for a uniformly rotating fluid with rotation frequency Ω/2π = 453 nHz. Modes with even azimuthal orders ranging from t = 2 to 16 are shown here.
Current usage metrics show cumulative count of Article Views (full-text article views including HTML views, PDF and ePub downloads, according to the available data) and Abstracts Views on Vision4Press platform.
Data correspond to usage on the plateform after 2015. The current usage metrics is available 48-96 hours after online publication and is updated daily on week days.
Initial download of the metrics may take a while.