Fig. 3.
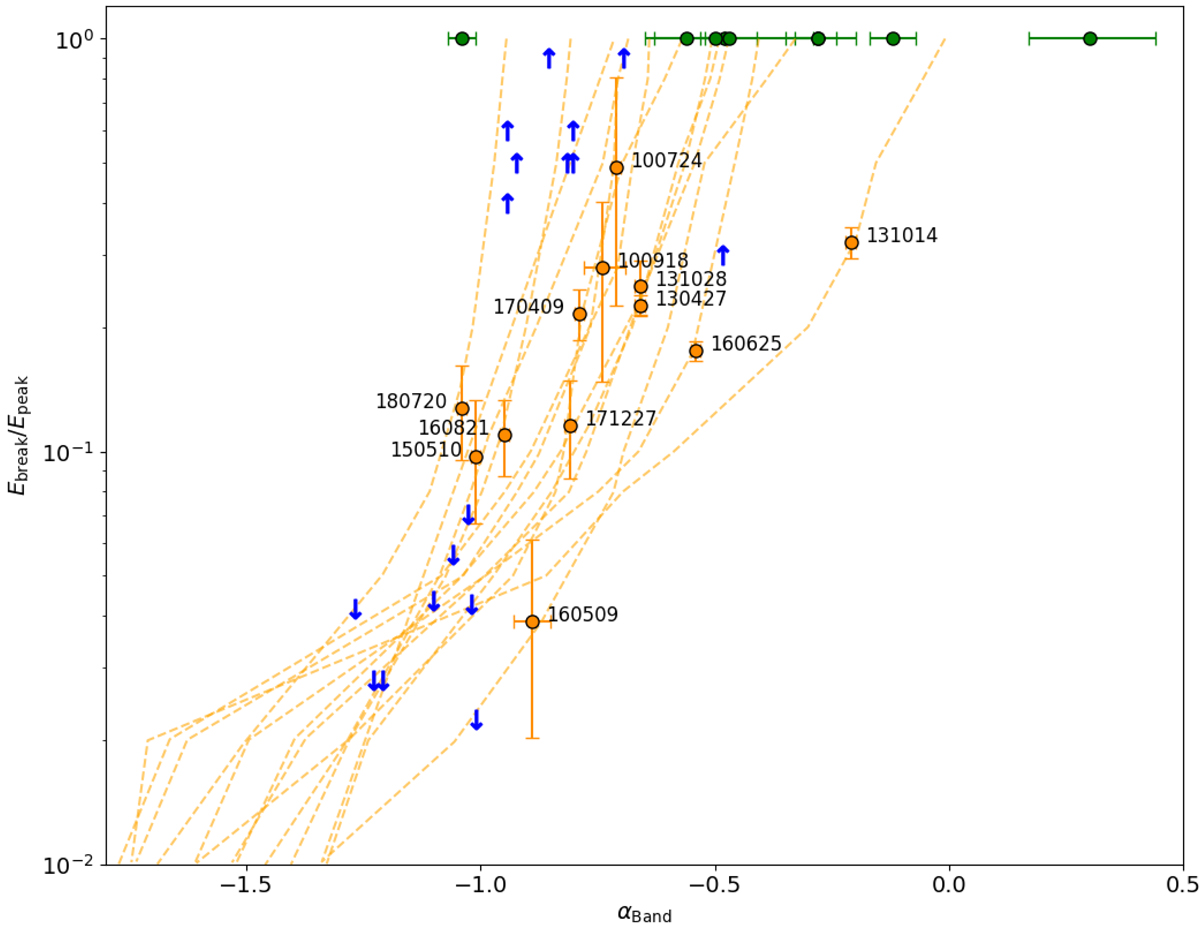
12 LGRBs best fitted by a 2SBPL (Table 1) shown with orange symbols. Their value of RE = Ebreak/Epeak is shown vs. the value of the index αBand that is obtained by fitting their spectrum with a Band function. SGRBs (whose spectrum is always best fitted by the Band function) are represented here assuming that, if the underlying spectrum were 2SBPL, it would be expected to have Ebreak ∼ Epeak (green symbols). The orange dashed lines show the results of simulations (see Sect. 4.2); blue arrows represent the upper and lower limits on RE for the 15 LGRBs whose spectra are best fitted by Band (see Sect. 4.3).
Current usage metrics show cumulative count of Article Views (full-text article views including HTML views, PDF and ePub downloads, according to the available data) and Abstracts Views on Vision4Press platform.
Data correspond to usage on the plateform after 2015. The current usage metrics is available 48-96 hours after online publication and is updated daily on week days.
Initial download of the metrics may take a while.