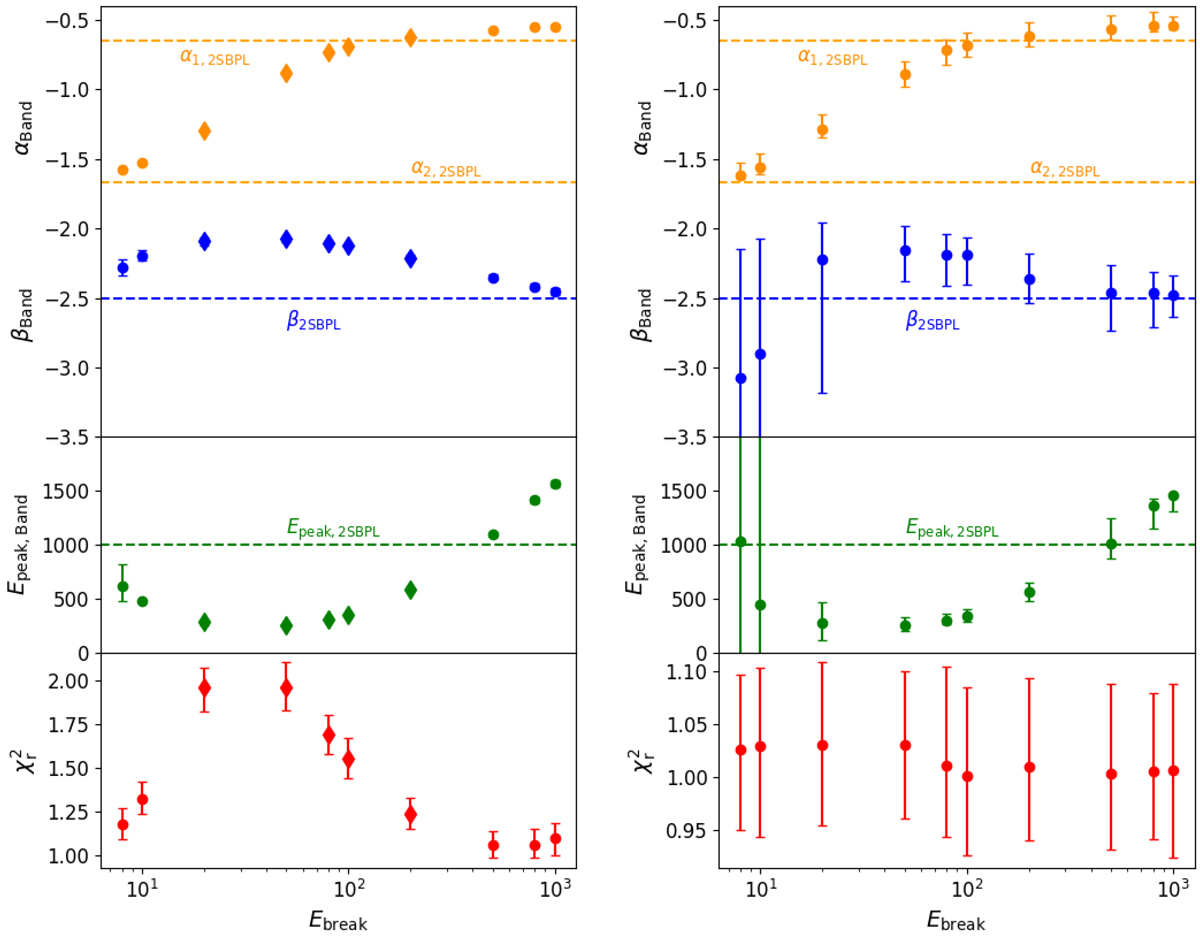
Fig. 2.
Band function parameters as a function of the position of the energy break Ebreak of the 2SBPL function. Each plot shows the parameters of the Band function fitted to a series of spectra simulated assuming the 2SBPL function whose parameter values are marked by the horizontal dashed lines. Top: low-energy slope αBand (orange symbols) and high-energy slope βBand (blue symbols). Middle: energy peak Epeak, Band (green symbols). Bottom: fit ![]() (red symbols). Left: spectrum characterized by a S/N ∼ 21 (fluence ∼3.5 ⋅ 10−4 erg cm−2). Right: spectrum characterized by S/N ∼ 2.7 (fluence ∼3.5 ⋅ 10−5 erg cm−2). Data are represented as circles when the best-fitting model is Band and as diamonds when the best-fitting model is 2SBPL.
(red symbols). Left: spectrum characterized by a S/N ∼ 21 (fluence ∼3.5 ⋅ 10−4 erg cm−2). Right: spectrum characterized by S/N ∼ 2.7 (fluence ∼3.5 ⋅ 10−5 erg cm−2). Data are represented as circles when the best-fitting model is Band and as diamonds when the best-fitting model is 2SBPL.
Current usage metrics show cumulative count of Article Views (full-text article views including HTML views, PDF and ePub downloads, according to the available data) and Abstracts Views on Vision4Press platform.
Data correspond to usage on the plateform after 2015. The current usage metrics is available 48-96 hours after online publication and is updated daily on week days.
Initial download of the metrics may take a while.