Free Access
Fig. 1.
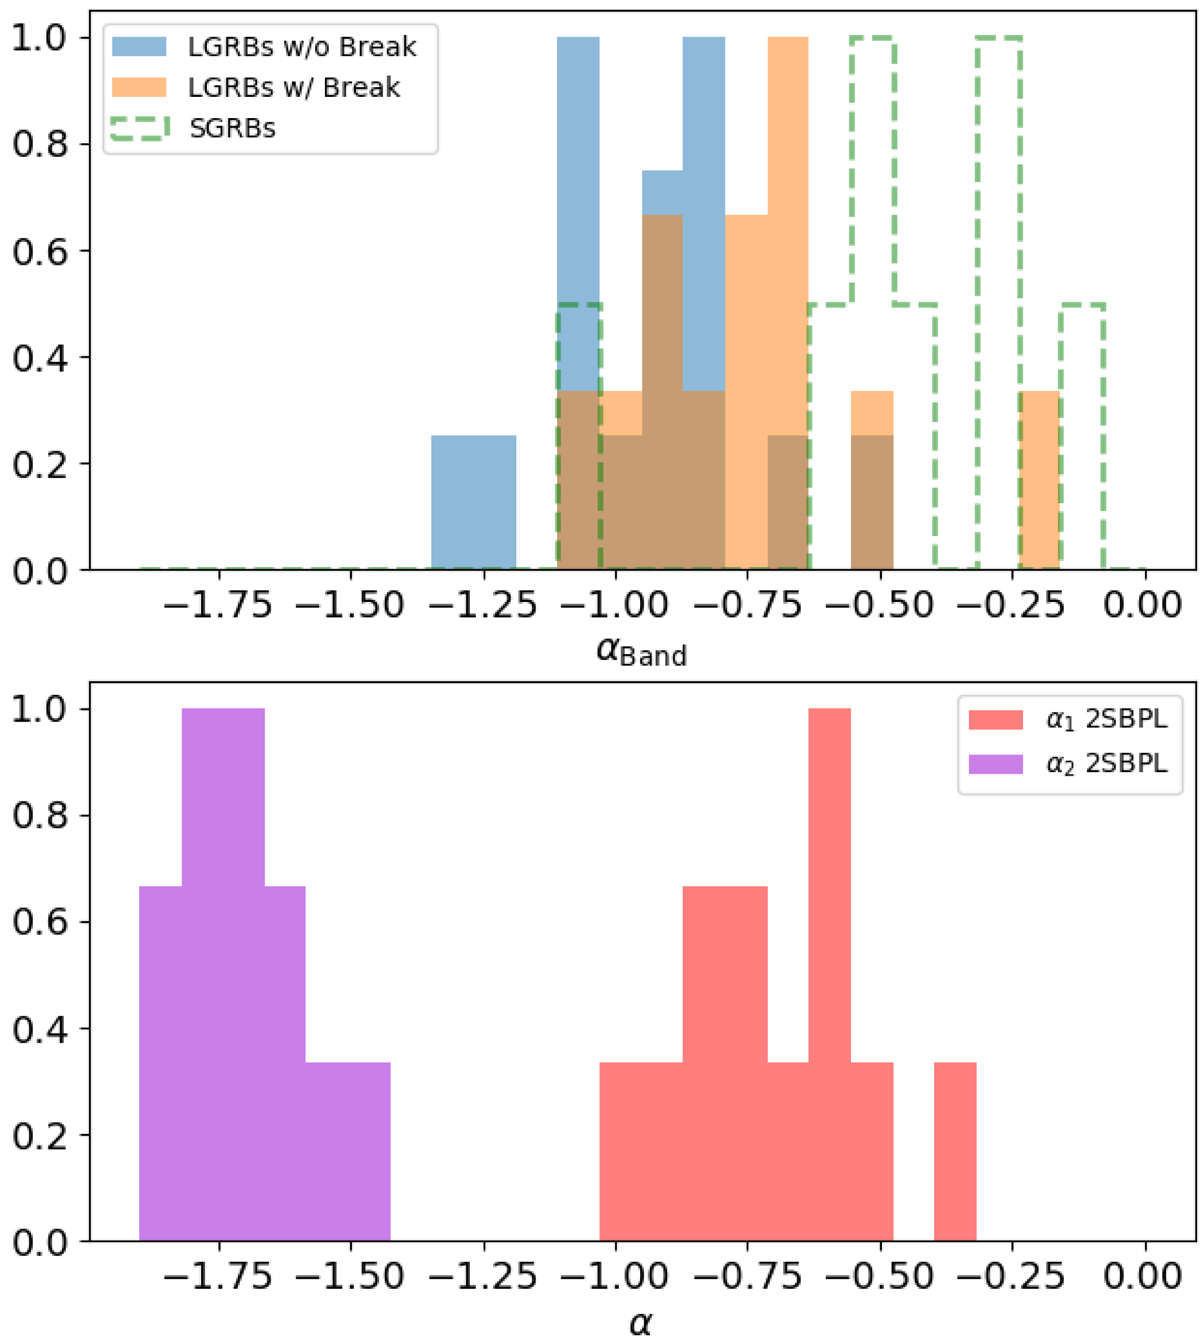
Top: distributions of αBand for SGRBs (green) and for both LGRBs with and without the low-energy spectral break (orange and blue histogram). Bottom: distributions of α1,2SBPL and α2,2SBPL of the 12 LGRBs best fitted by the 2SBPL (i.e., with the low-energy spectral break). Distributions are normalized to their peak values.
Current usage metrics show cumulative count of Article Views (full-text article views including HTML views, PDF and ePub downloads, according to the available data) and Abstracts Views on Vision4Press platform.
Data correspond to usage on the plateform after 2015. The current usage metrics is available 48-96 hours after online publication and is updated daily on week days.
Initial download of the metrics may take a while.