Fig. 8.
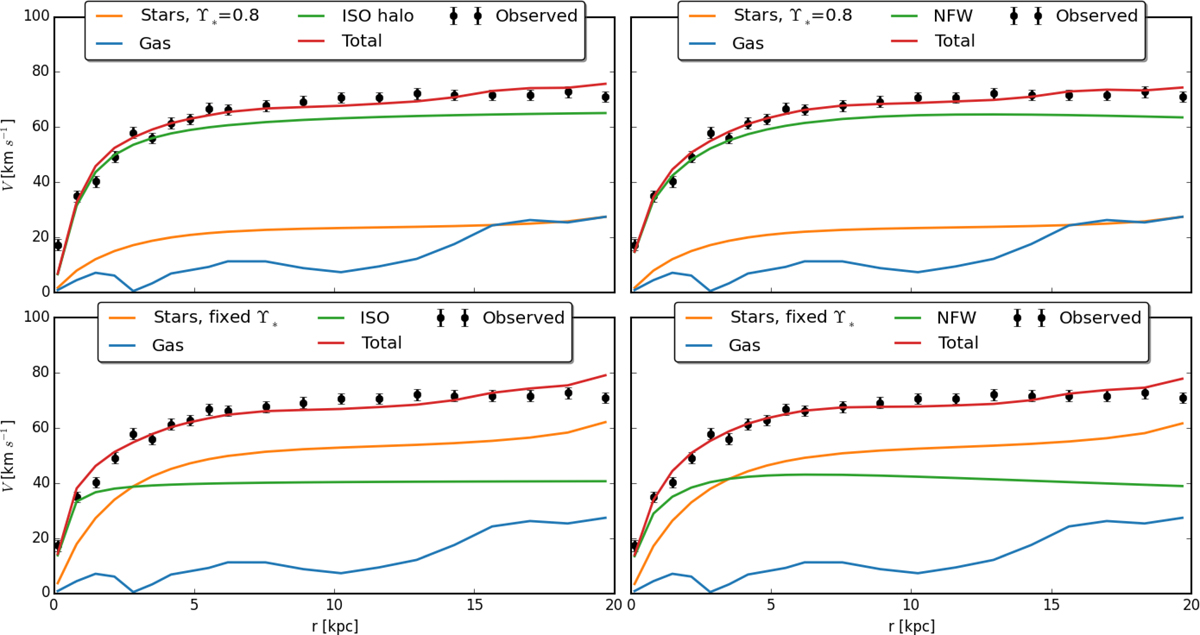
Modelling the H I rotation curve of the Fourcade-Figueroa galaxy. Upper panels: ISO and the NFW halo based mass model for the maximum disk with Υ⋆ = 0.8. Lower panels: ISO and the NFW halo based mass model for the maximum disk considering ∼75% contribution to the peak of the rotation curve at R = 2.2rs. The orange line indicates the rotation curve due to the stellar disk, the blue line that due to the gas disk, the green line that due to the DM halo, and the red line shows the best-fitting model rotation curve.
Current usage metrics show cumulative count of Article Views (full-text article views including HTML views, PDF and ePub downloads, according to the available data) and Abstracts Views on Vision4Press platform.
Data correspond to usage on the plateform after 2015. The current usage metrics is available 48-96 hours after online publication and is updated daily on week days.
Initial download of the metrics may take a while.