Free Access
Fig. 7.
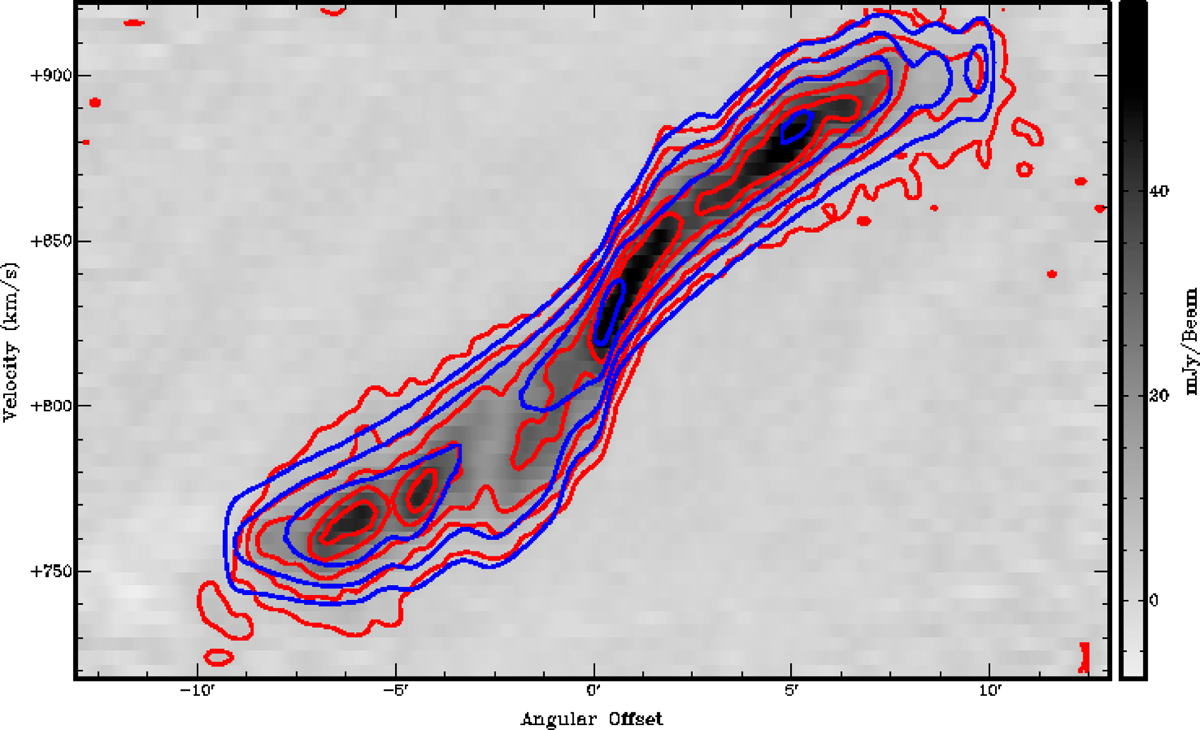
H Ipv diagram along the major axis is shown in grey and red contours. The blue contour levels represent the pv of the model galaxy. The contour levels are 4, 9, 17, 29 and 39 mJy beam−1 km s−1.
Current usage metrics show cumulative count of Article Views (full-text article views including HTML views, PDF and ePub downloads, according to the available data) and Abstracts Views on Vision4Press platform.
Data correspond to usage on the plateform after 2015. The current usage metrics is available 48-96 hours after online publication and is updated daily on week days.
Initial download of the metrics may take a while.