Fig. 6.
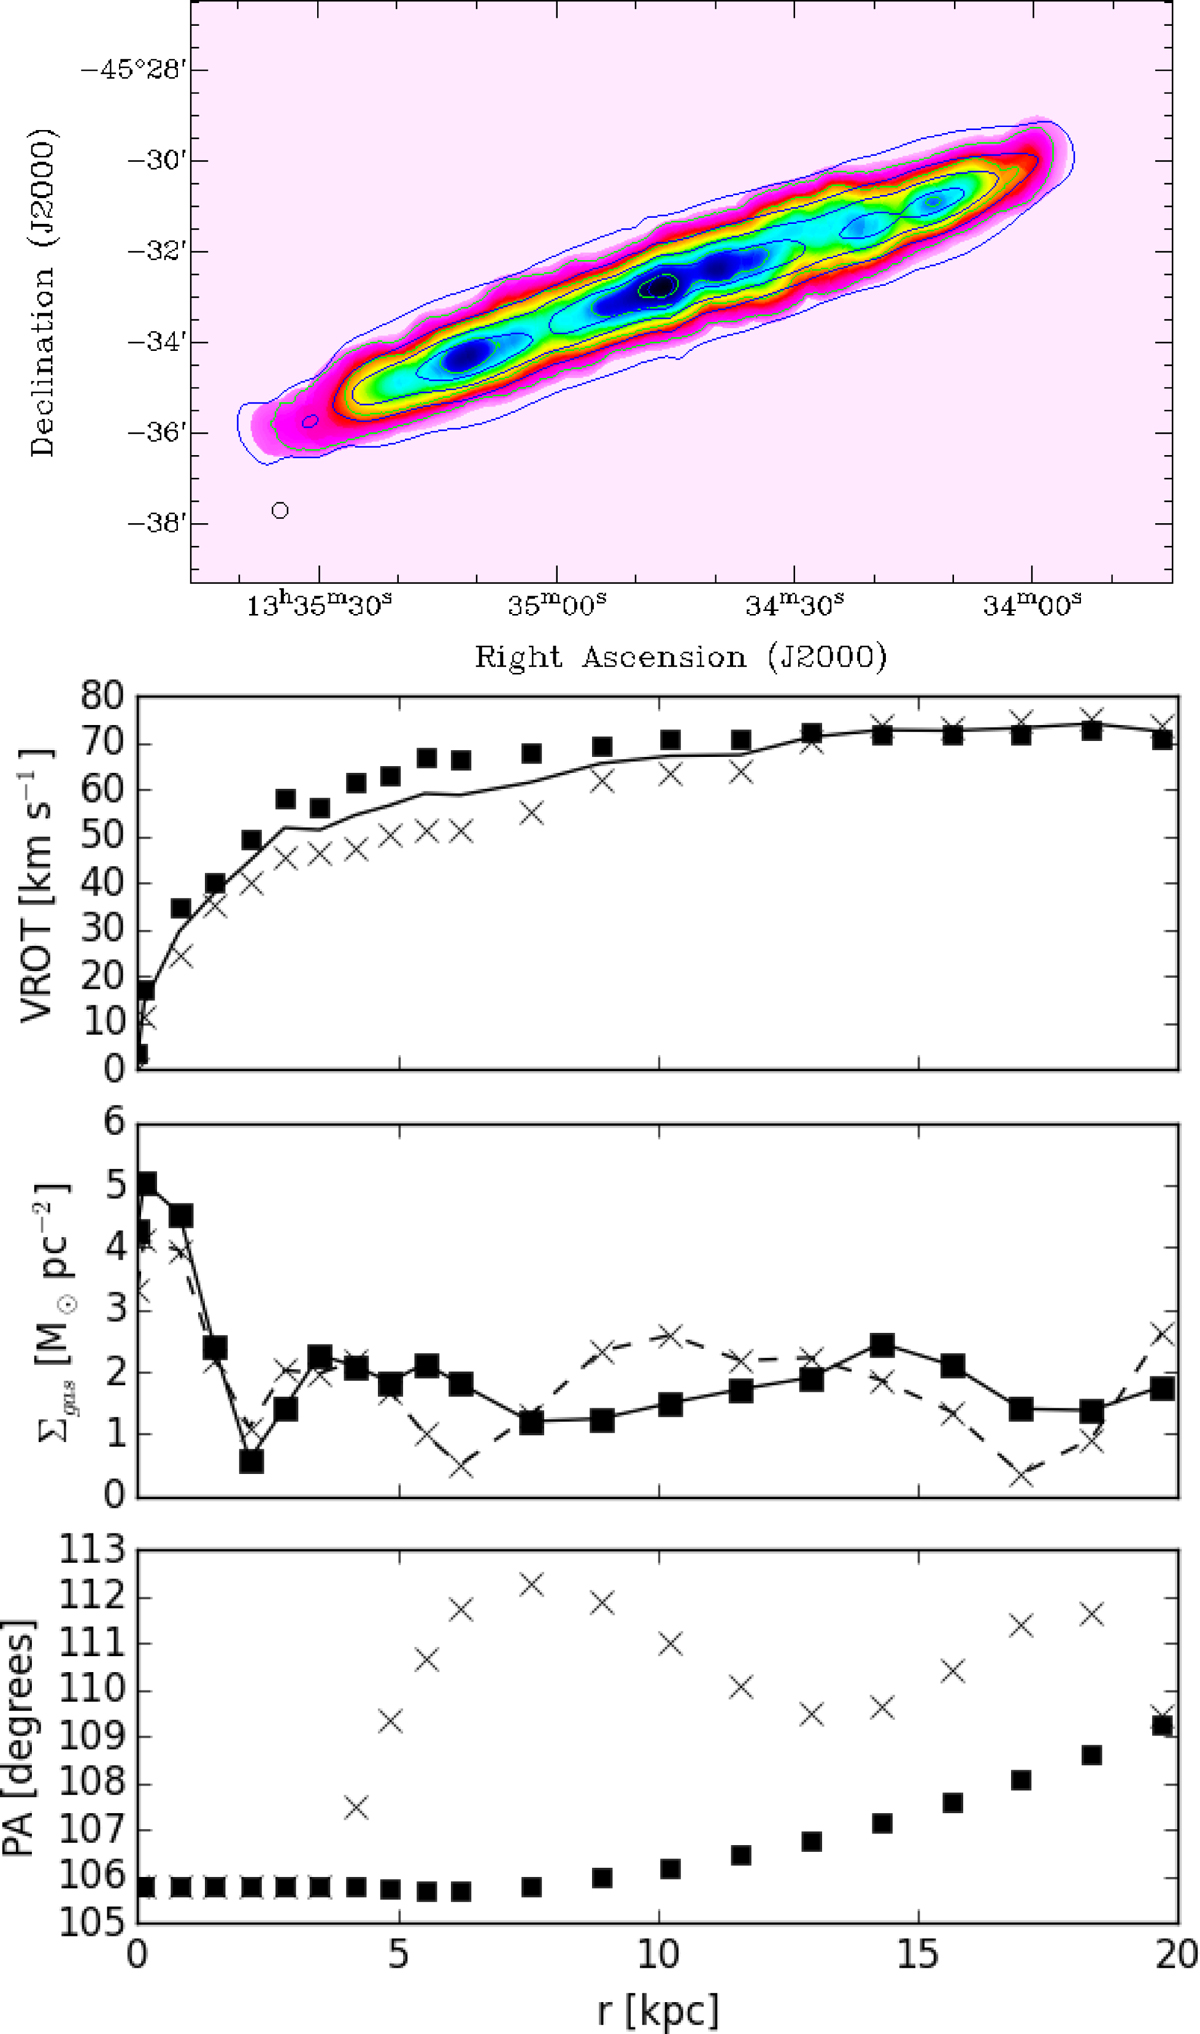
First row: comparison of data (green) and model (blue) moment-zero maps. Rows 2–4: model parameters as a function of radius. The crosses and squares represent the approaching and receding halves of the FF galaxy. Second row: rotation curve. The solid curve corresponds to the mean rotation curve. Third row: de-projected H I gas surface distribution. Fourth row: position angle variation.
Current usage metrics show cumulative count of Article Views (full-text article views including HTML views, PDF and ePub downloads, according to the available data) and Abstracts Views on Vision4Press platform.
Data correspond to usage on the plateform after 2015. The current usage metrics is available 48-96 hours after online publication and is updated daily on week days.
Initial download of the metrics may take a while.