Fig. 4.
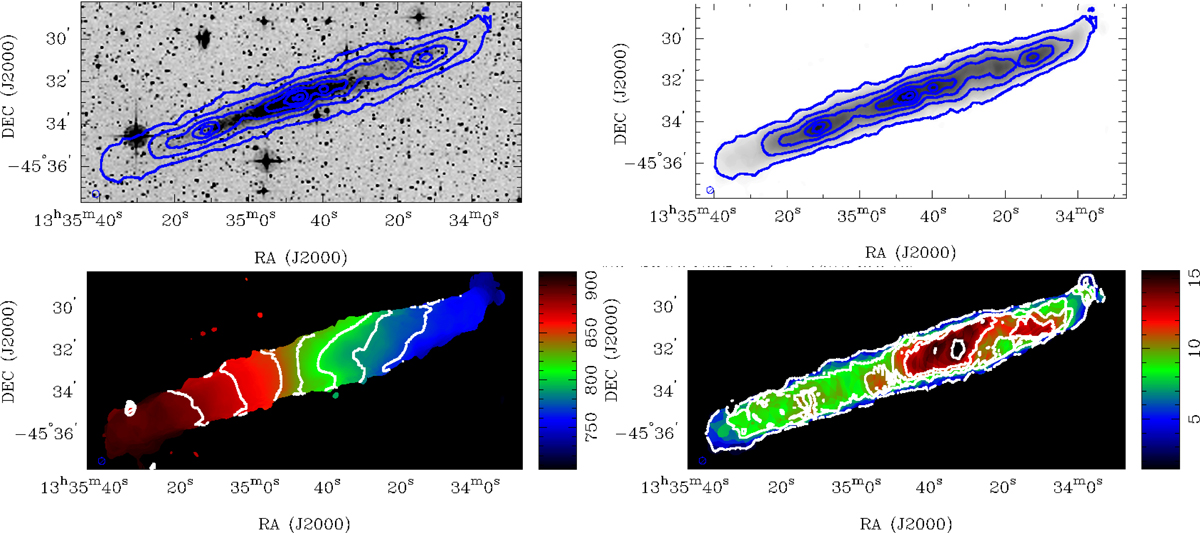
ATCA+GMRT H I moment maps of the Fourcade-Figueroa galaxy. Top left panel: H I distribution overlaid on the DSS2 I-band image. The H I contour levels are 0.24, 0.9, 1.7, and 2.1 Jy beam−1 km s−1. Top right panel: H I distribution (same contours). Bottom left panel: velocity field, the contour levels are 768, 788, 808, 828, 848, 868, and 888 km s−1. Bottom right panel: velocity dispersion; the contour levels are 3, 8, 10, 12, and 15 km s−1. The H I distribution maps were made using the low-resolution cube with a synthesised beam of 20″ × 20″.
Current usage metrics show cumulative count of Article Views (full-text article views including HTML views, PDF and ePub downloads, according to the available data) and Abstracts Views on Vision4Press platform.
Data correspond to usage on the plateform after 2015. The current usage metrics is available 48-96 hours after online publication and is updated daily on week days.
Initial download of the metrics may take a while.