Free Access
Fig. 3.
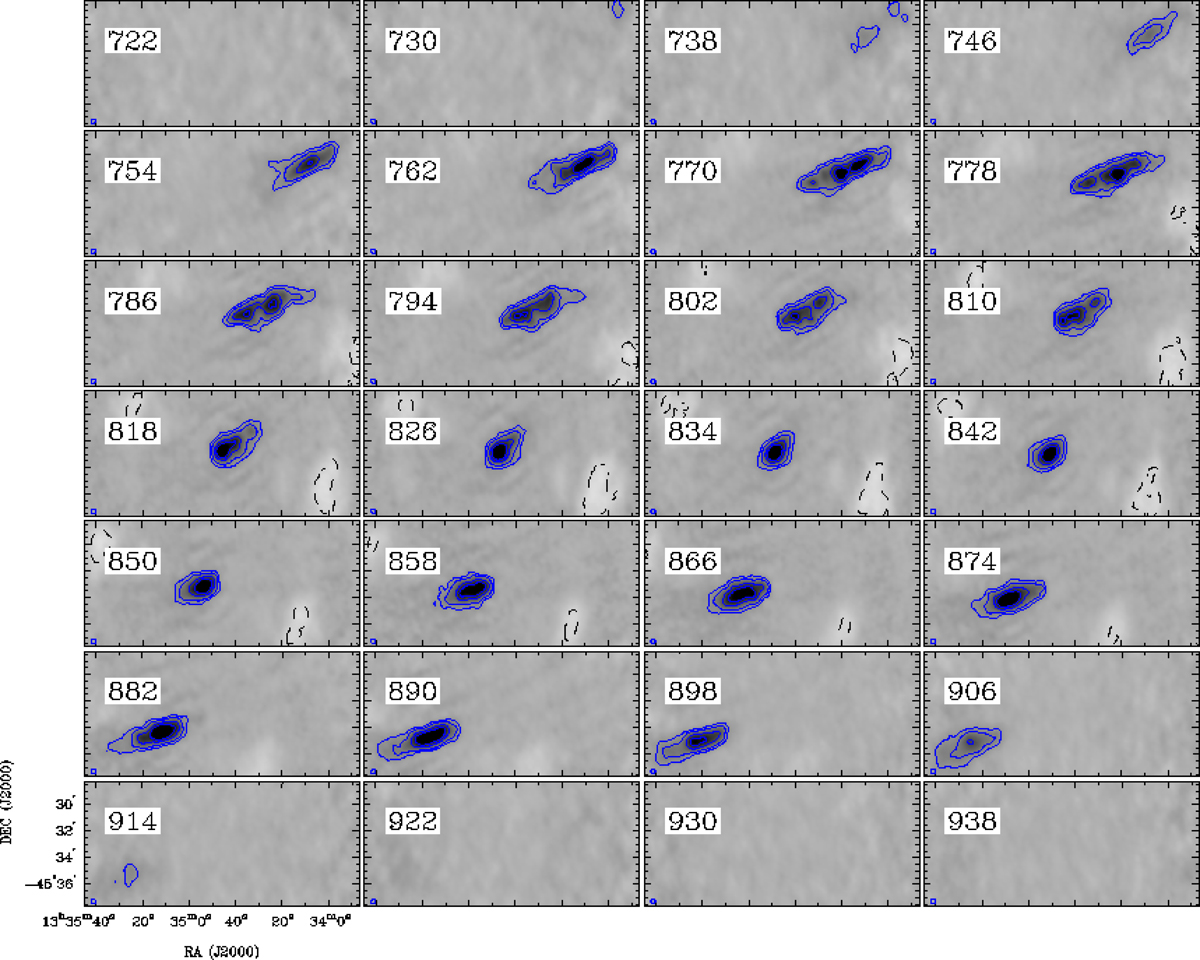
ATCA+GMRT high-resolution H I channel maps of the Fourcade-Figueroa galaxy. The channel velocity is shown in the top left corner (in km s−1) and the synthesised beam (20″) in the bottom left corner of each panel. The contour levels are −6, 6, 15, 25, and 35 mJy beam−1.
Current usage metrics show cumulative count of Article Views (full-text article views including HTML views, PDF and ePub downloads, according to the available data) and Abstracts Views on Vision4Press platform.
Data correspond to usage on the plateform after 2015. The current usage metrics is available 48-96 hours after online publication and is updated daily on week days.
Initial download of the metrics may take a while.