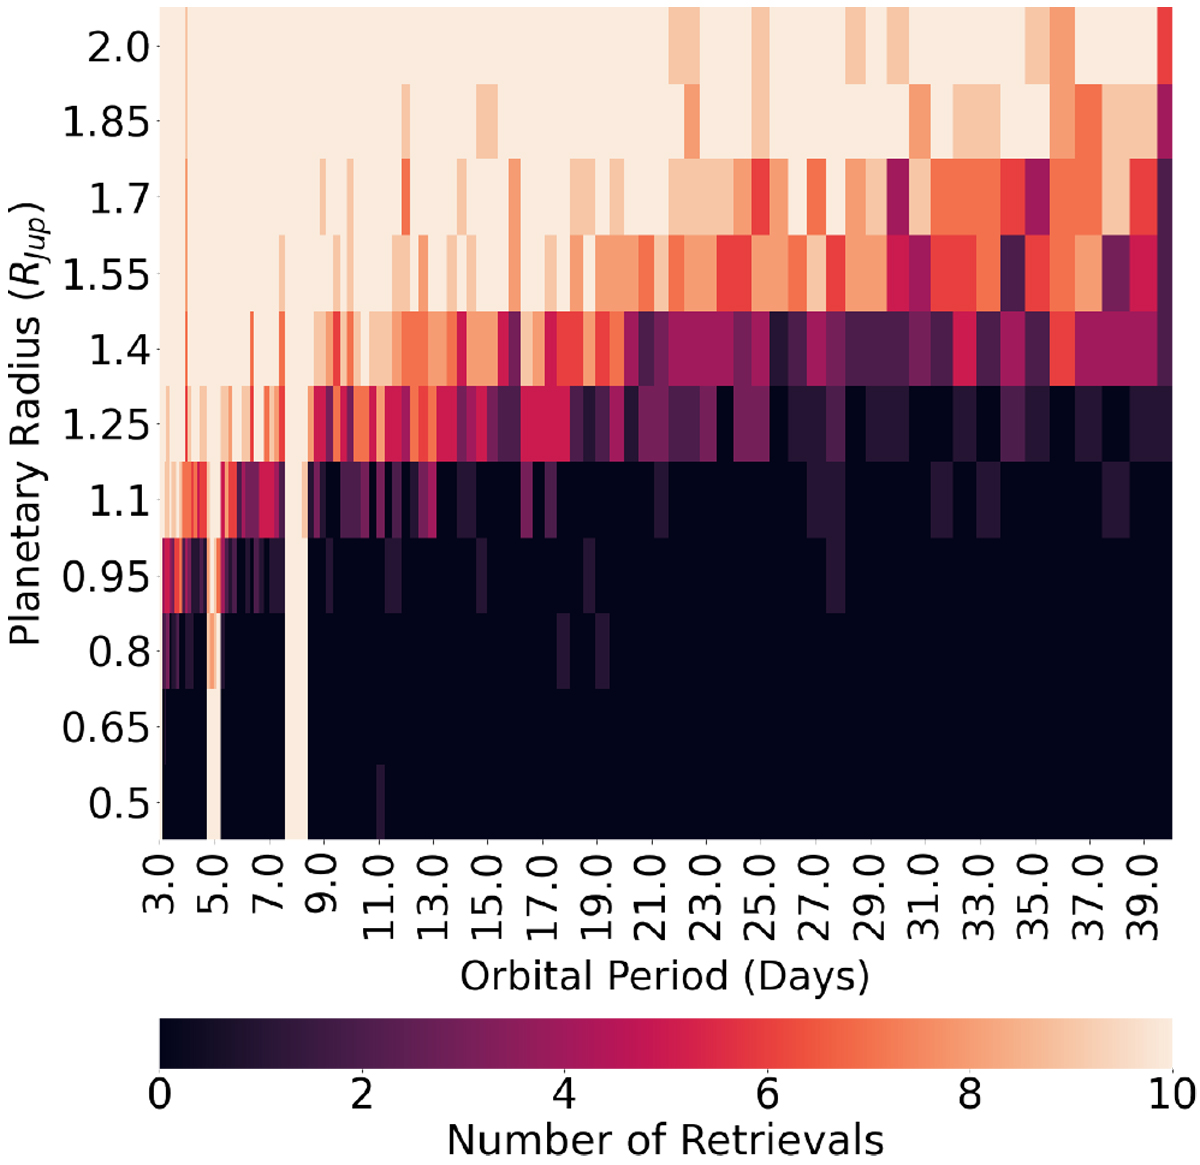
Fig. 8

Sensitivity of the TLS algorithm in the J1407 system for generated transits with different radii and orbital periods injected in the real data. Columns on the right-hand side of the plot are broader than ones on the left-hand side due to the logarithmic grid spacing. The corresponding masses were taken from the 20 Myr AMES-Dusty models (Allard et al. 2001).
Current usage metrics show cumulative count of Article Views (full-text article views including HTML views, PDF and ePub downloads, according to the available data) and Abstracts Views on Vision4Press platform.
Data correspond to usage on the plateform after 2015. The current usage metrics is available 48-96 hours after online publication and is updated daily on week days.
Initial download of the metrics may take a while.


