Fig. 7
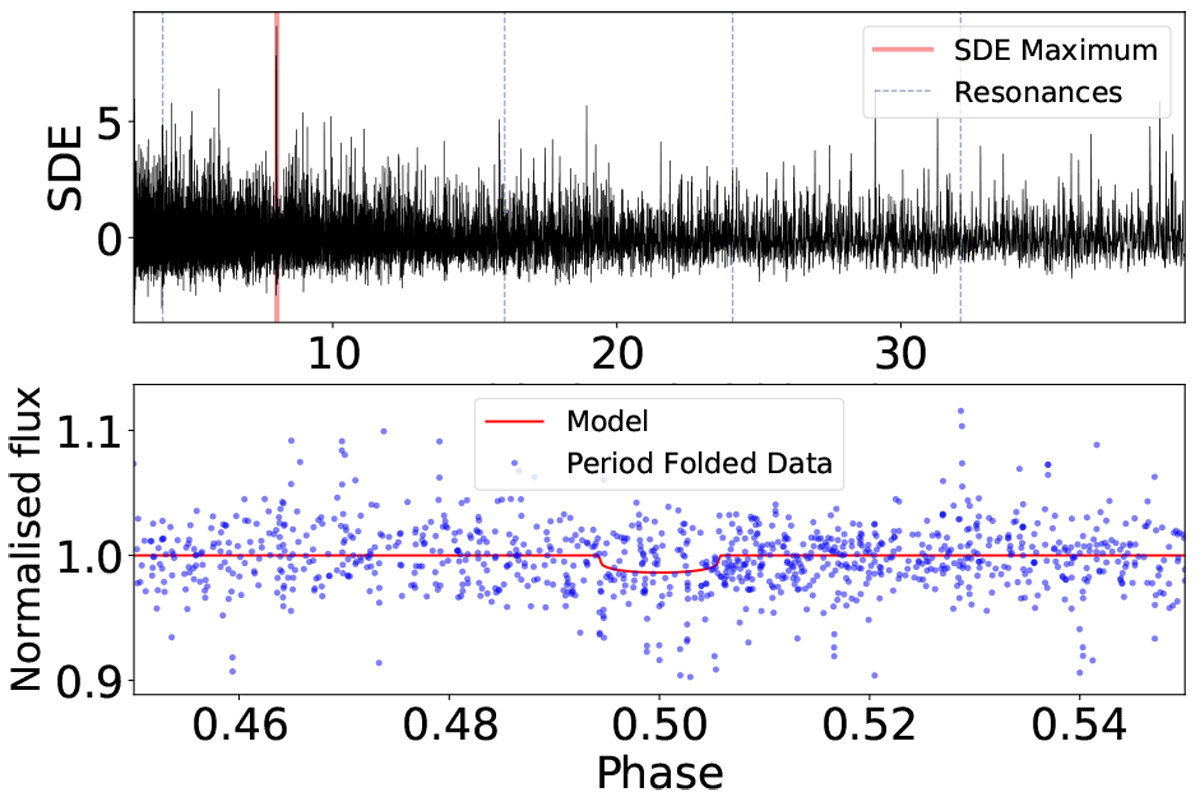
Upper plot: transit least squares (TLS) spectrum for the ground-based data. The TLS maximum has a value of 9.09 and is located at an orbital period of 8.03 days. Lower plot: ground-based data folded over the most likely orbital period. The fitted model for the transit has a depth of 1.4% (1.1 RJup) and a duration of 0.093 days.
Current usage metrics show cumulative count of Article Views (full-text article views including HTML views, PDF and ePub downloads, according to the available data) and Abstracts Views on Vision4Press platform.
Data correspond to usage on the plateform after 2015. The current usage metrics is available 48-96 hours after online publication and is updated daily on week days.
Initial download of the metrics may take a while.