Fig. 8
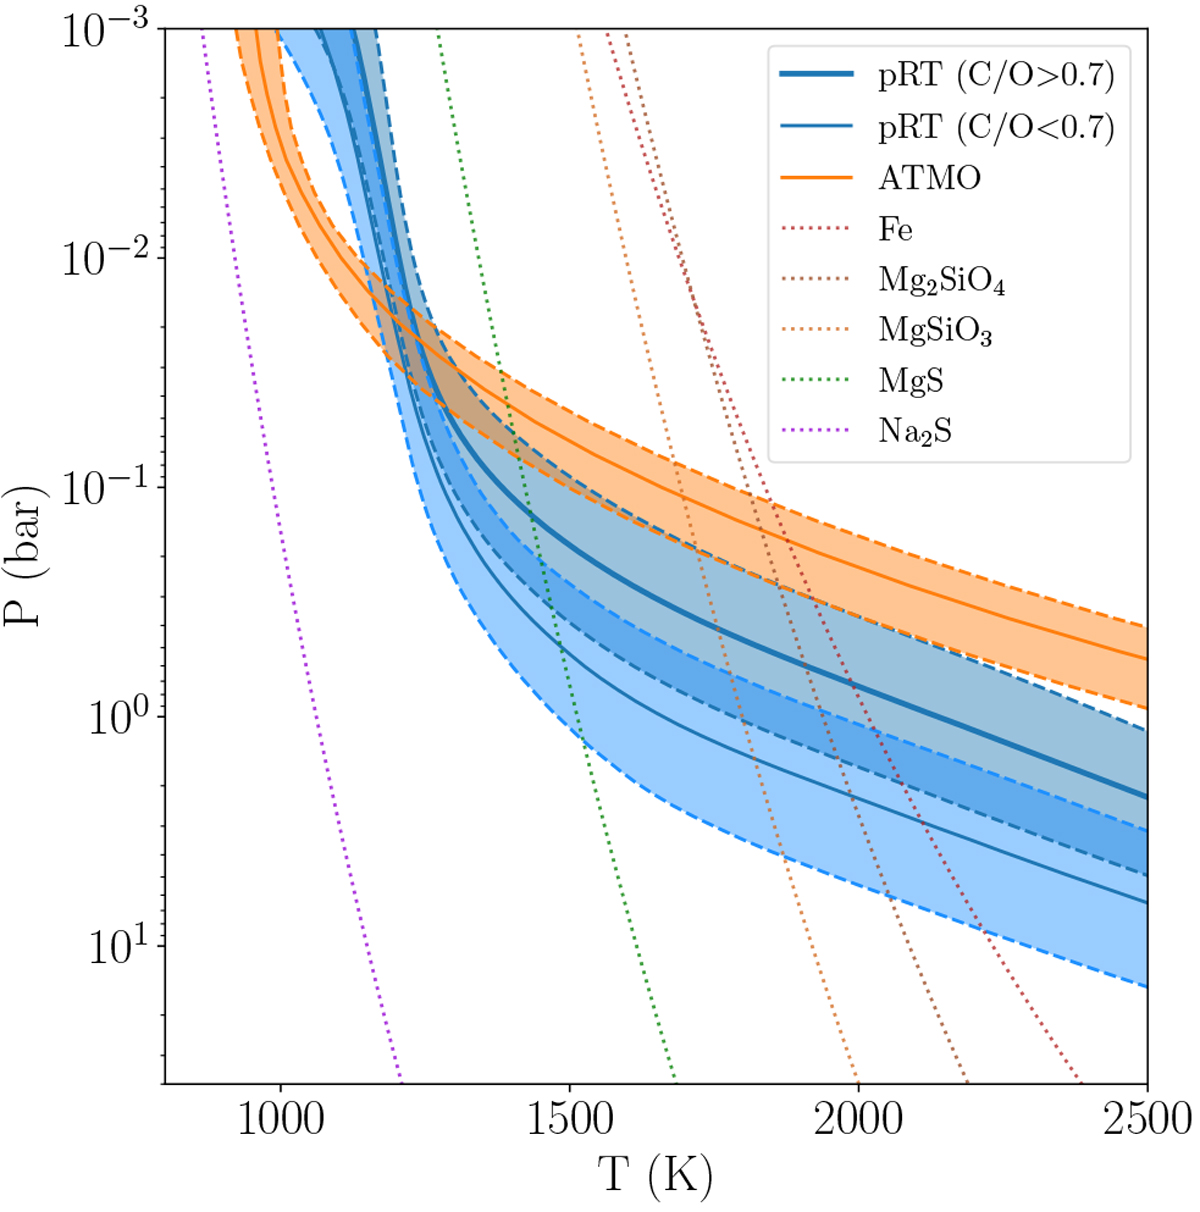
Pressure-temperature profiles of the atmosphere of HD 206893 B retrieved with petitRADTRANS (pRT) and ATMO. The dashed lines show the 1–σ confidence intervals. With pRT we obtain a bimodal posterior for the C/O ratio and the quenching pressure, and the P–T profile for each of the two solutions is shown separately (thick blue line C/O > 0.7, thin blue line C/O < 0.7). All models probe approximately 0.01 to 0.1 bar pressure levels. Dotted lines indicate the condensation curves of various species calculated at 10× solar abundance (Visscher et al. 2010).
Current usage metrics show cumulative count of Article Views (full-text article views including HTML views, PDF and ePub downloads, according to the available data) and Abstracts Views on Vision4Press platform.
Data correspond to usage on the plateform after 2015. The current usage metrics is available 48-96 hours after online publication and is updated daily on week days.
Initial download of the metrics may take a while.