Fig. 4
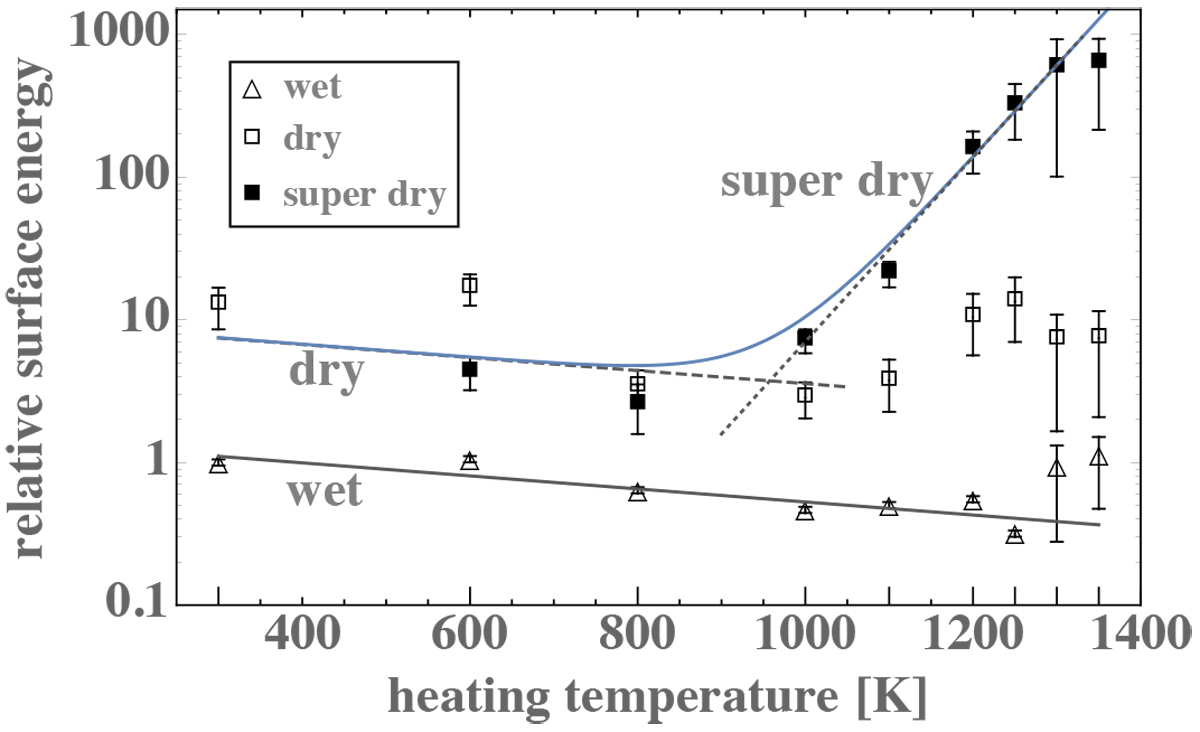
Relative surface energy (![]() ) for the wet (triangles), dry (open squares) and super dry (filled squares) chondritic sample. Continuous line: exponential trend using data of wet sample up to 1250 K. Dashed line to dry data points: exponential trend to the data up to 1000 K including super dry data up to 800 K with same inclination as for wet samples. Dotted line to super dry data: exponential trend based on data up to 1300 K. Blue line: our model for the overall effective surface energy dependence on temperature.
) for the wet (triangles), dry (open squares) and super dry (filled squares) chondritic sample. Continuous line: exponential trend using data of wet sample up to 1250 K. Dashed line to dry data points: exponential trend to the data up to 1000 K including super dry data up to 800 K with same inclination as for wet samples. Dotted line to super dry data: exponential trend based on data up to 1300 K. Blue line: our model for the overall effective surface energy dependence on temperature.
Current usage metrics show cumulative count of Article Views (full-text article views including HTML views, PDF and ePub downloads, according to the available data) and Abstracts Views on Vision4Press platform.
Data correspond to usage on the plateform after 2015. The current usage metrics is available 48-96 hours after online publication and is updated daily on week days.
Initial download of the metrics may take a while.