Open Access
Fig. 6
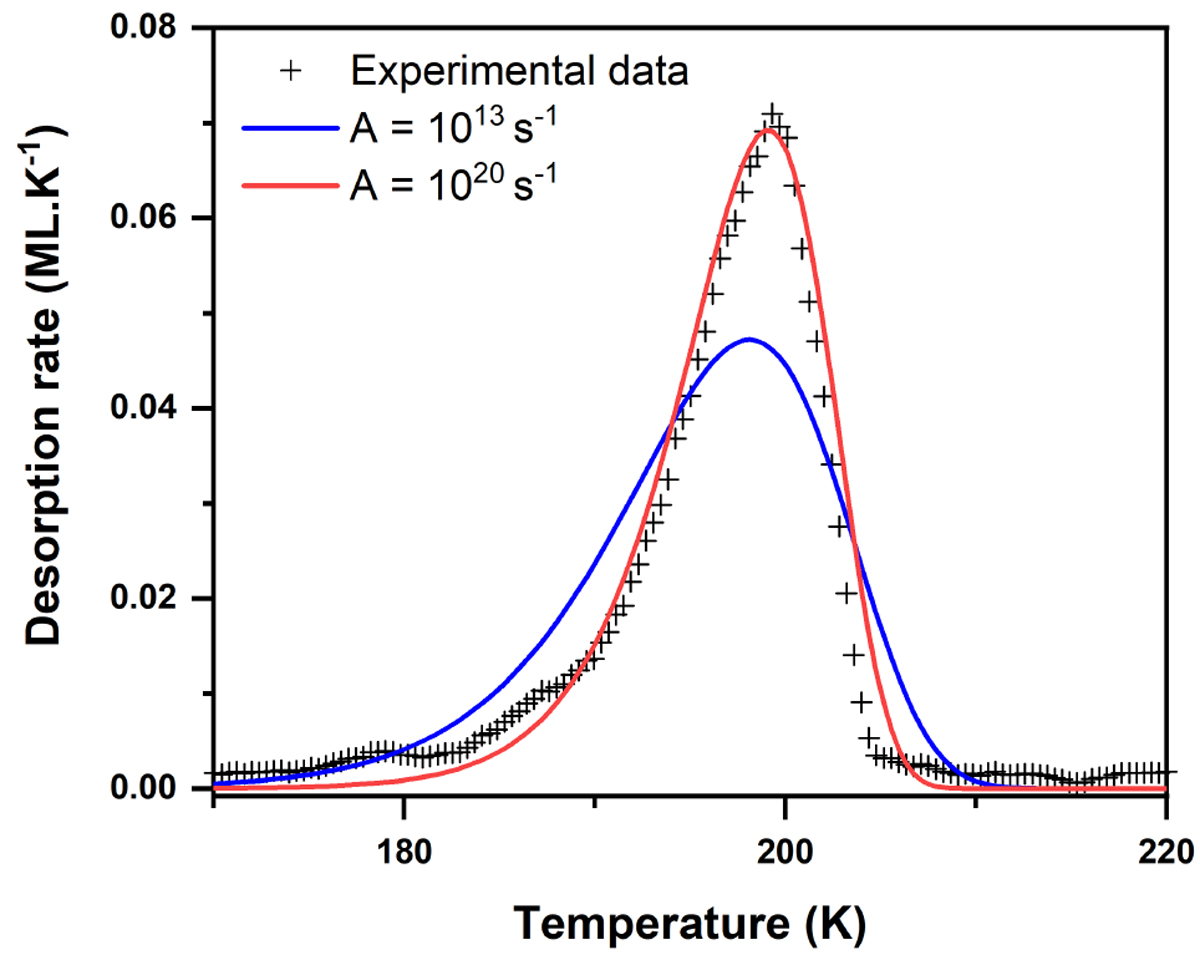
TPD curve of ammonium acetate is better fitted using a high value of the pre-exponential factor, A = 1020 s−1, instead of A = 1013 s−1 used for the other molecules. This difference probably occurs because we measure the desorption process and a multi-step reaction that includes the dissociation of ammonium acetate.
Current usage metrics show cumulative count of Article Views (full-text article views including HTML views, PDF and ePub downloads, according to the available data) and Abstracts Views on Vision4Press platform.
Data correspond to usage on the plateform after 2015. The current usage metrics is available 48-96 hours after online publication and is updated daily on week days.
Initial download of the metrics may take a while.