Open Access
Fig. 5
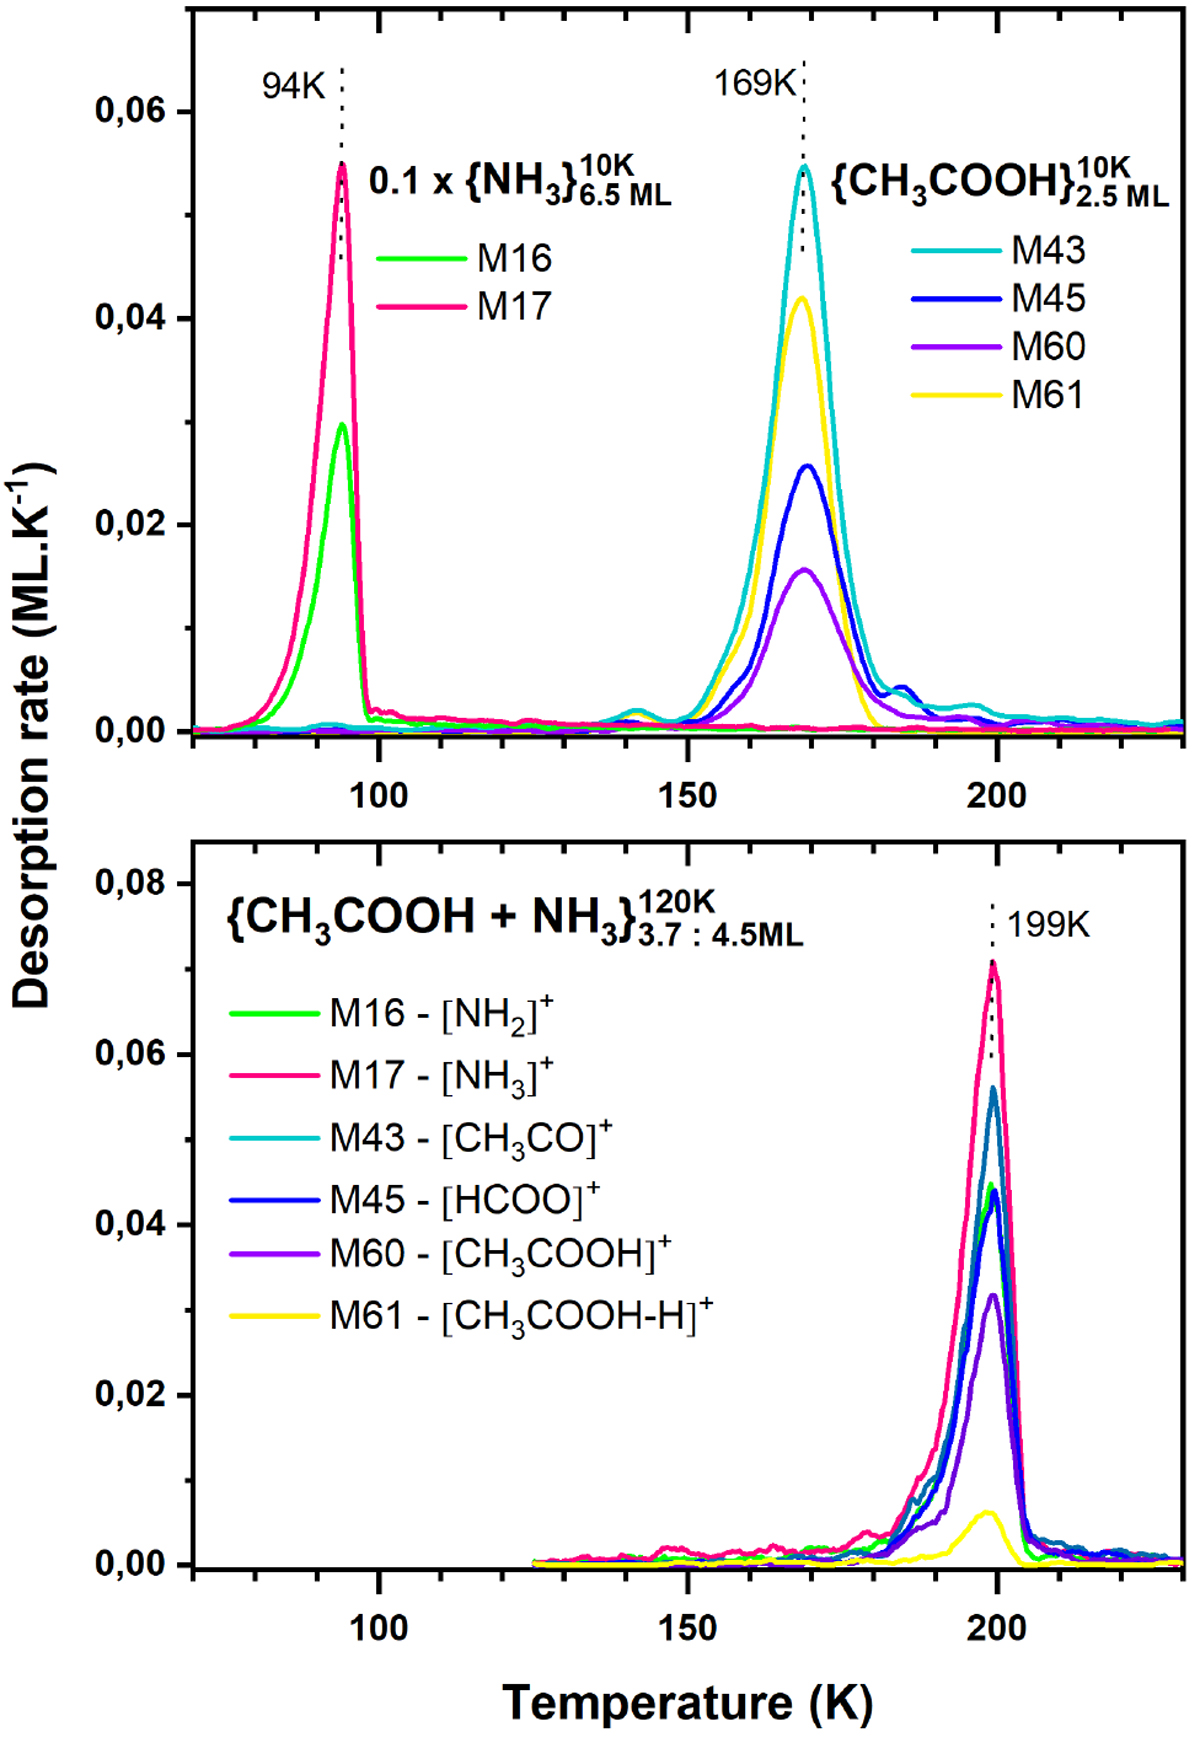
TPD spectra of experiments involving ammonium acetate. Top panel: TPD spectra of NH3 and CH3COOH. Bottom panel: TPD spectrum of NH4 +CH3COO−; the sharp profile of the desorption is linked with a high pre-exponential factor and may indicate that the dissociation of the salt is at the origin of the desorption process.
Current usage metrics show cumulative count of Article Views (full-text article views including HTML views, PDF and ePub downloads, according to the available data) and Abstracts Views on Vision4Press platform.
Data correspond to usage on the plateform after 2015. The current usage metrics is available 48-96 hours after online publication and is updated daily on week days.
Initial download of the metrics may take a while.