Fig. 3
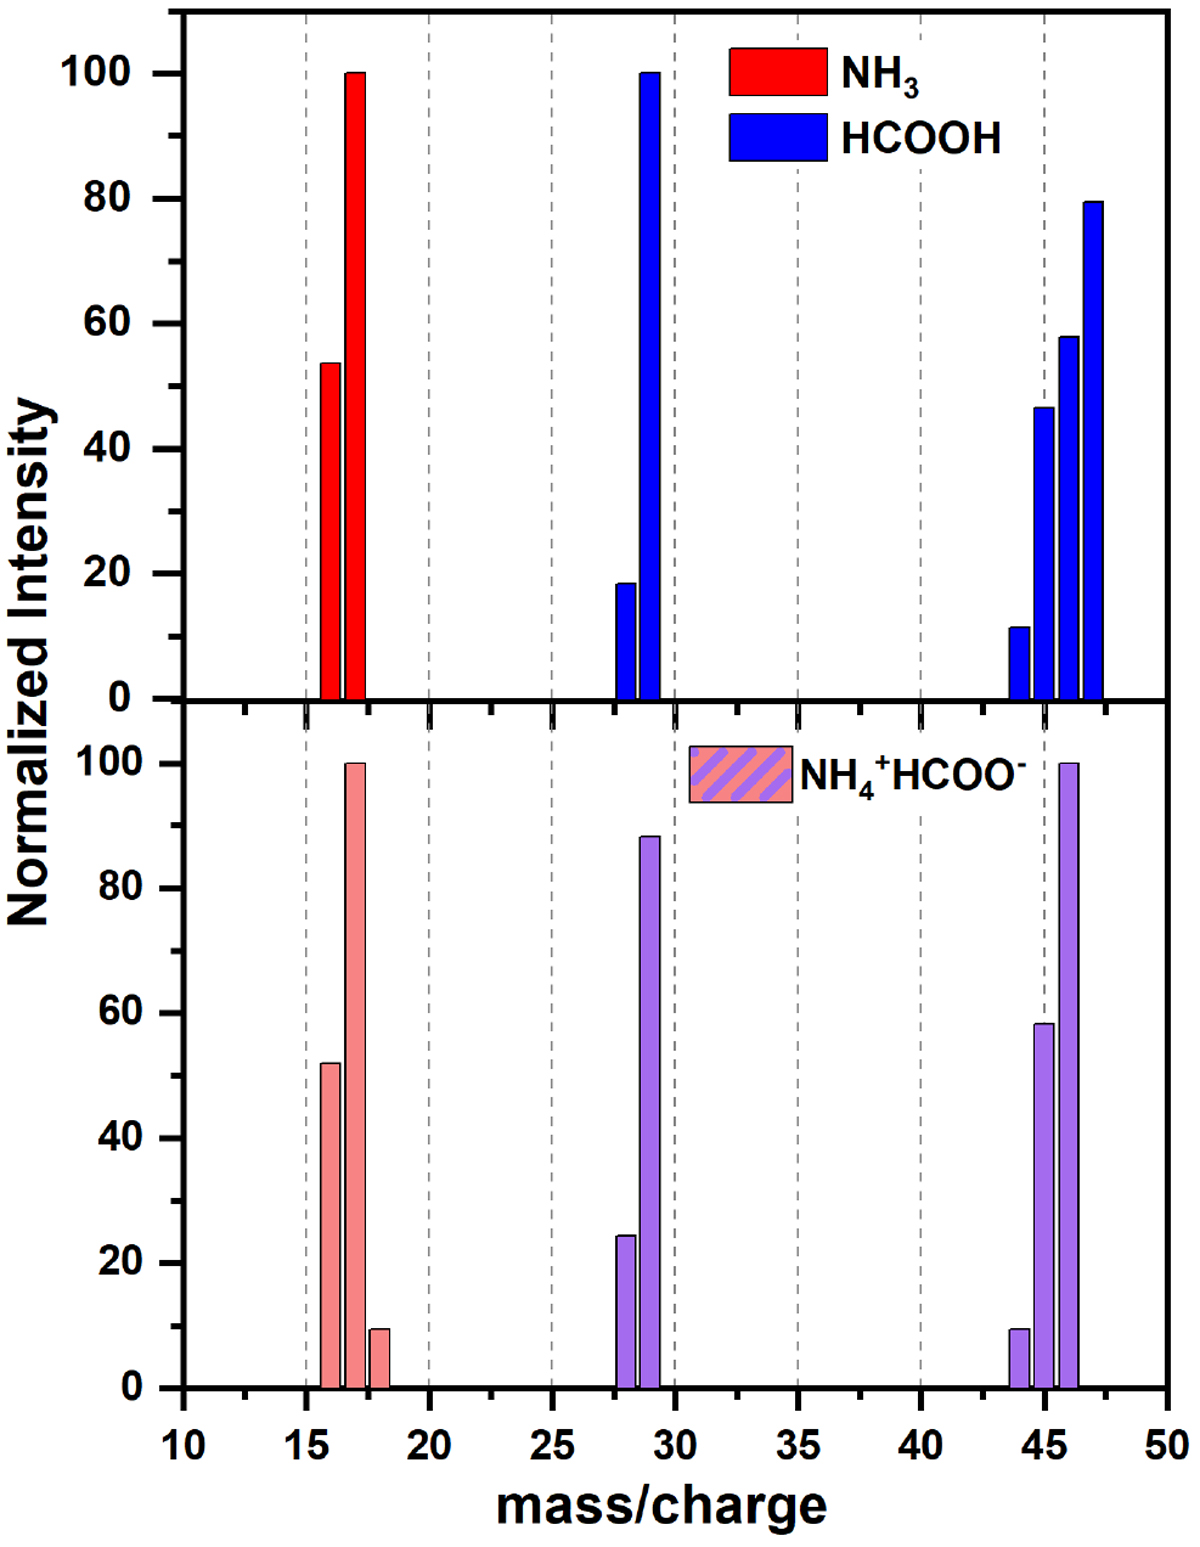
Mass spectra of NH3, HCOOH, and NH4 +HCOO−. Intensities are normalized to the most intense of the peaks for NH3 (m∕z = 17) and HCOOH (m∕z = 29). For NH4 +HCOO− the fragments corresponding to ammonia are normalized to the most intense of the peaks (m∕z = 17) and those from formic acid to the second most intense peak (m∕z = 46).
Current usage metrics show cumulative count of Article Views (full-text article views including HTML views, PDF and ePub downloads, according to the available data) and Abstracts Views on Vision4Press platform.
Data correspond to usage on the plateform after 2015. The current usage metrics is available 48-96 hours after online publication and is updated daily on week days.
Initial download of the metrics may take a while.