Fig. 8.
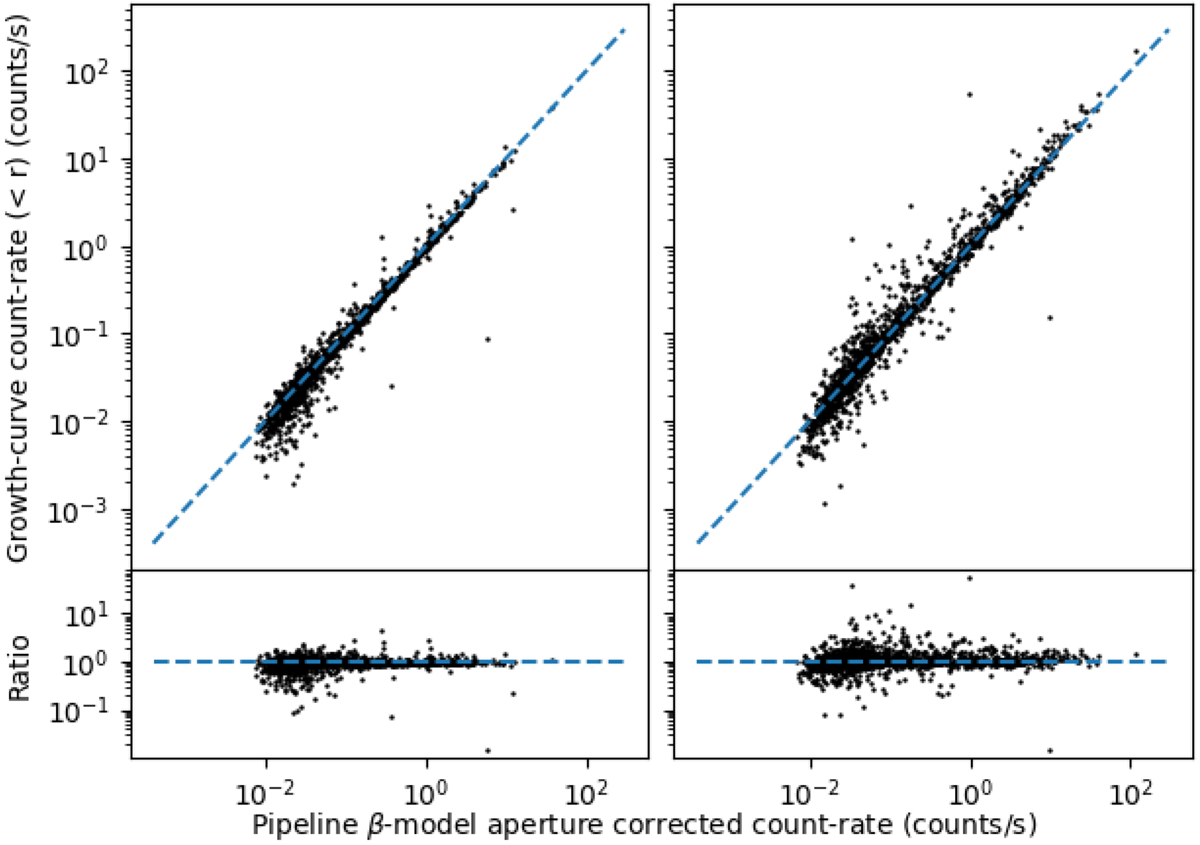
Comparison between the count rate measured by the source detection pipeline and the manual curve of growth analysis for the 1559 galaxy clusters in the sample. The values represent the equivalent on-axis count rate in the [0.5−2] keV energy band combining all three detectors, estimated within identical apertures r. Left panel: r = 1 arcmin. Right panel: r = Rfit, a radius that is unique to each source and adapted to the signal-to-noise ratio in the measurement images. In both panels, the dashed line represents equality. Uncertainties are only available for manual measurements and are not shown in this figure.
Current usage metrics show cumulative count of Article Views (full-text article views including HTML views, PDF and ePub downloads, according to the available data) and Abstracts Views on Vision4Press platform.
Data correspond to usage on the plateform after 2015. The current usage metrics is available 48-96 hours after online publication and is updated daily on week days.
Initial download of the metrics may take a while.