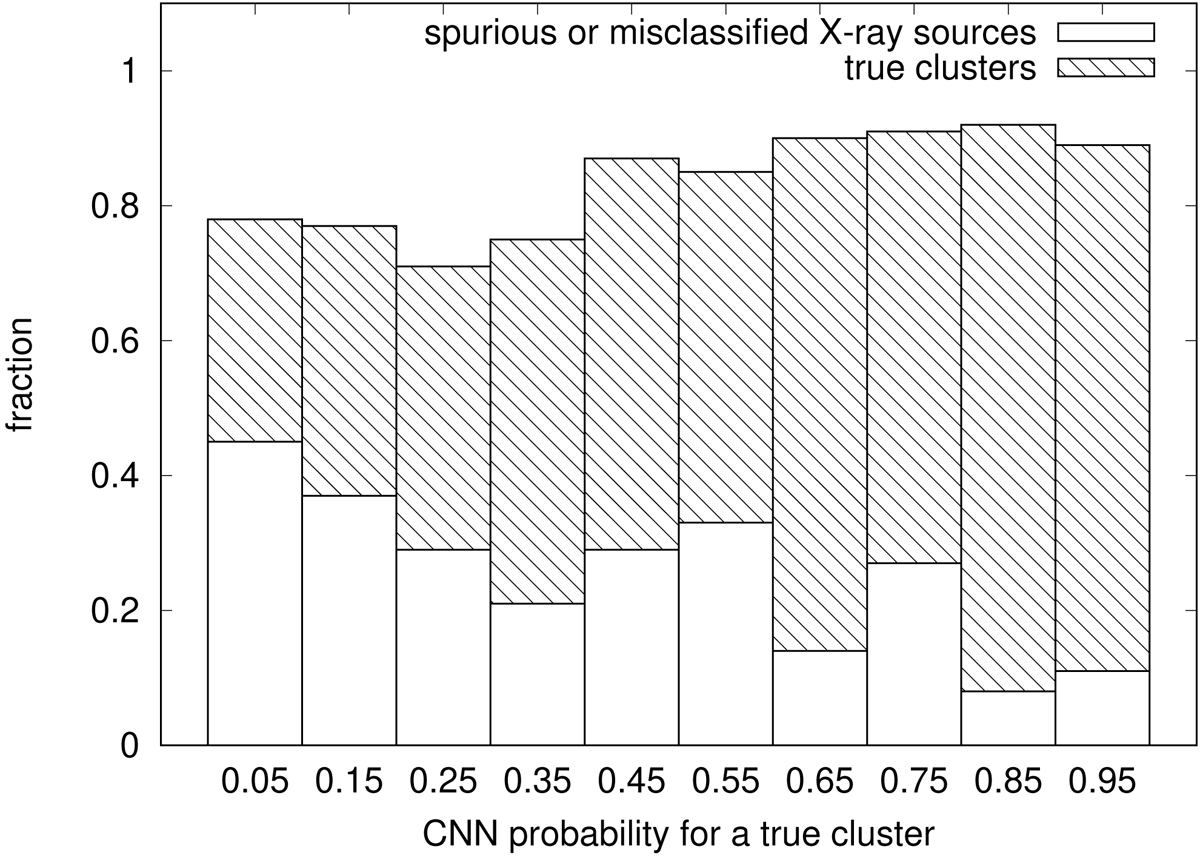
Fig. A.1.

Agreement between CNN classification and expert opinion. The hatched area shows the fraction of sources agreed upon by all researchers as being true clusters, while the empty area shows the false detections agreed upon by all researchers. The percentage of sources for which the expert opinions are mixed is omitted for clarity, but these sources account for the remaining fraction up to 1 for each bin. The number of sources in each bin varies from 10 to 33. CNNs are shown to be more effective in identifying true clusters in the last two bins (CNN prob. > 80%) and false detections in the first bin (CNN prob. < 10%).
Current usage metrics show cumulative count of Article Views (full-text article views including HTML views, PDF and ePub downloads, according to the available data) and Abstracts Views on Vision4Press platform.
Data correspond to usage on the plateform after 2015. The current usage metrics is available 48-96 hours after online publication and is updated daily on week days.
Initial download of the metrics may take a while.


